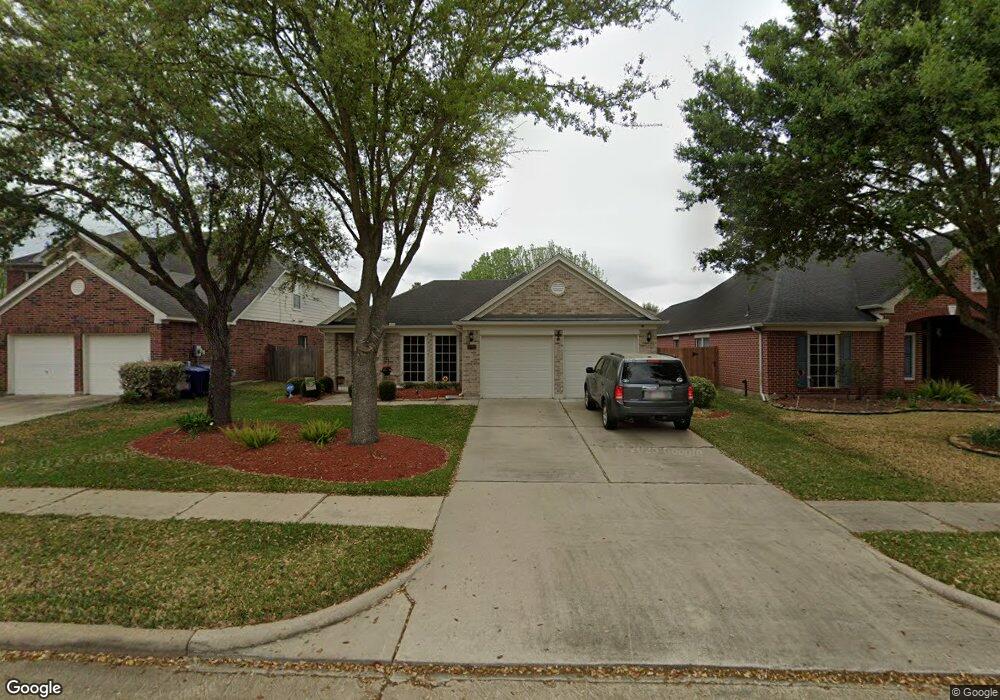
17019 Terrace Park Dr Houston, TX 77095
Copperfield NeighborhoodEstimated Value: $277,744 - $312,000
3
Beds
2
Baths
1,724
Sq Ft
$169/Sq Ft
Est. Value
About This Home
This home is located at 17019 Terrace Park Dr, Houston, TX 77095 and is currently estimated at $291,686, approximately $169 per square foot. 17019 Terrace Park Dr is a home located in Harris County with nearby schools including Holmsley Elementary School, Aragon Middle School, and Langham Creek High School.
Ownership History
Date
Name
Owned For
Owner Type
Purchase Details
Closed on
Apr 29, 2022
Sold by
Webb Steven D and Webb Melida S
Bought by
Webb Steven D and Webb Steven D
Current Estimated Value
Purchase Details
Closed on
Apr 30, 2014
Sold by
Webster Linda
Bought by
Webb Steven D and Webb Melinda S
Home Financials for this Owner
Home Financials are based on the most recent Mortgage that was taken out on this home.
Original Mortgage
$124,000
Interest Rate
4.46%
Mortgage Type
New Conventional
Purchase Details
Closed on
Aug 27, 2004
Sold by
Perry Homes
Bought by
Bollier Allen C and Bollier Zaida L
Home Financials for this Owner
Home Financials are based on the most recent Mortgage that was taken out on this home.
Original Mortgage
$125,400
Interest Rate
5.81%
Mortgage Type
Purchase Money Mortgage
Create a Home Valuation Report for This Property
The Home Valuation Report is an in-depth analysis detailing your home's value as well as a comparison with similar homes in the area
Home Values in the Area
Average Home Value in this Area
Purchase History
| Date | Buyer | Sale Price | Title Company |
|---|---|---|---|
| Webb Steven D | -- | None Listed On Document | |
| Webb Steven D | -- | First American Title | |
| Bollier Allen C | -- | Chicago Title |
Source: Public Records
Mortgage History
| Date | Status | Borrower | Loan Amount |
|---|---|---|---|
| Previous Owner | Webb Steven D | $124,000 | |
| Previous Owner | Bollier Allen C | $125,400 |
Source: Public Records
Tax History Compared to Growth
Tax History
| Year | Tax Paid | Tax Assessment Tax Assessment Total Assessment is a certain percentage of the fair market value that is determined by local assessors to be the total taxable value of land and additions on the property. | Land | Improvement |
|---|---|---|---|---|
| 2025 | $6,567 | $274,493 | $59,225 | $215,268 |
| 2024 | $6,567 | $269,386 | $59,225 | $210,161 |
| 2023 | $6,567 | $286,482 | $59,225 | $227,257 |
| 2022 | $6,477 | $250,286 | $42,207 | $208,079 |
| 2021 | $5,509 | $203,572 | $42,207 | $161,365 |
| 2020 | $5,358 | $192,780 | $32,336 | $160,444 |
| 2019 | $5,186 | $180,953 | $24,847 | $156,106 |
| 2018 | $2,448 | $169,968 | $24,847 | $145,121 |
| 2017 | $4,872 | $169,968 | $24,847 | $145,121 |
| 2016 | $4,644 | $162,024 | $24,847 | $137,177 |
| 2015 | $1,814 | $162,024 | $24,847 | $137,177 |
| 2014 | $1,814 | $149,703 | $24,847 | $124,856 |
Source: Public Records
Map
Nearby Homes
- 17230 Valhallah Way
- 17206 Haley Falls Ln
- 16902 Terrace Park Dr
- 17003 Summer Dew Ln
- 7306 Bubbling Brooks Ln
- 17234 Rush Trace Ct
- 17222 Crown Meadow Ct
- 7311 Barton Oaks Dr
- 17015 Sky Blue Place
- 7254 Sonnet Glen Ln
- 17326 Masonridge Dr
- 16734 Pebbleglen Dr
- 7539 Wildwood Brook Ct
- 16911 Shady Square Ct
- 17325 Fm 529 Rd
- 17214 Palm Falls Ct
- 17523 Hamilwood Dr
- 17250 Cricketbriar Ct
- 17527 Hamilwood Dr
- 17531 Hamilwood Dr
- 17023 Terrace Park Dr
- 17015 Terrace Park Dr
- 17027 Terrace Park Dr
- 17011 Terrace Park Dr
- 7311 Slippery Elm Ln
- 7315 Slippery Elm Ln
- 7307 Slippery Elm Ln
- 17202 Autumn Blossom Ct
- 7303 Slippery Elm Ln
- 7319 Slippery Elm Ln
- 7323 Slippery Elm Ln
- 17206 Autumn Blossom Ct
- 17203 Valhallah Way
- 17003 Terrace Park Dr
- 7327 Slippery Elm Ln
- 17207 Valhallah Way
- 17103 Terrace Park Dr
- 16931 Terrace Park Dr
- 17210 Autumn Blossom Ct
- 7227 Sheffield Falls Ct