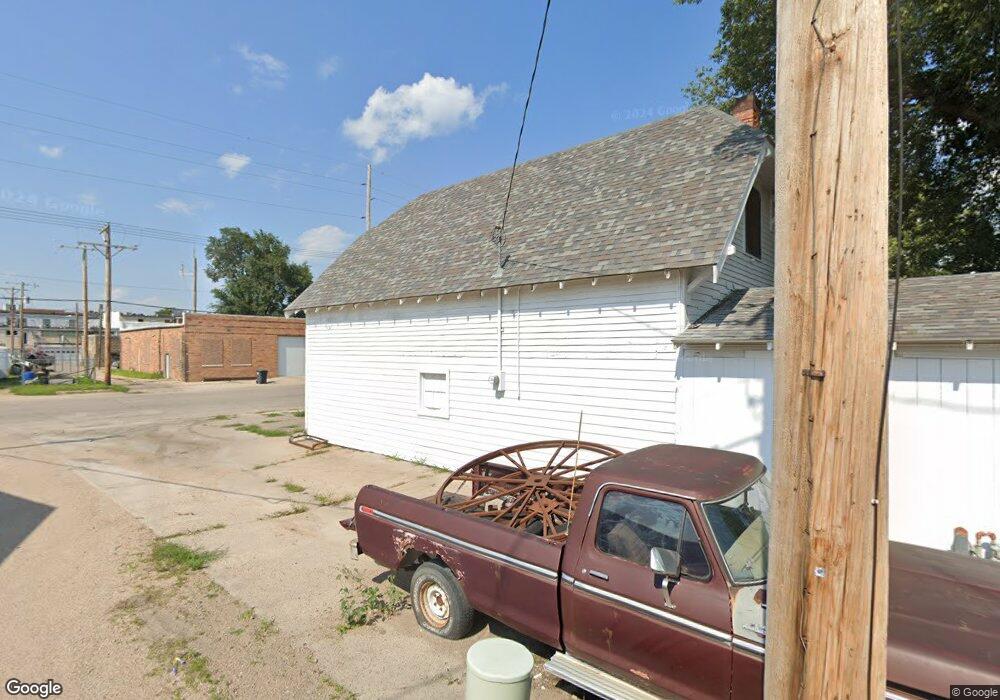
1702 16th Ave Central City, NE 68826
Estimated Value: $93,000 - $156,000
3
Beds
1
Bath
1,435
Sq Ft
$84/Sq Ft
Est. Value
About This Home
This home is located at 1702 16th Ave, Central City, NE 68826 and is currently estimated at $120,404, approximately $83 per square foot. 1702 16th Ave is a home located in Merrick County with nearby schools including Central City Elementary School, Central City Middle School, and Central City High School.
Ownership History
Date
Name
Owned For
Owner Type
Purchase Details
Closed on
Aug 22, 2016
Sold by
Bd Holdings Llc
Bought by
Gulbrandson Michelle R and Gulbrandson Dudley K
Current Estimated Value
Home Financials for this Owner
Home Financials are based on the most recent Mortgage that was taken out on this home.
Original Mortgage
$41,000
Outstanding Balance
$32,650
Interest Rate
3.42%
Mortgage Type
Future Advance Clause Open End Mortgage
Estimated Equity
$87,754
Purchase Details
Closed on
Nov 14, 2008
Sold by
Federal National Mortgage Association
Bought by
Bd Holdings Llc
Create a Home Valuation Report for This Property
The Home Valuation Report is an in-depth analysis detailing your home's value as well as a comparison with similar homes in the area
Home Values in the Area
Average Home Value in this Area
Purchase History
| Date | Buyer | Sale Price | Title Company |
|---|---|---|---|
| Gulbrandson Michelle R | $44,000 | None Available | |
| Bd Holdings Llc | -- | None Available |
Source: Public Records
Mortgage History
| Date | Status | Borrower | Loan Amount |
|---|---|---|---|
| Open | Gulbrandson Michelle R | $41,000 |
Source: Public Records
Tax History Compared to Growth
Tax History
| Year | Tax Paid | Tax Assessment Tax Assessment Total Assessment is a certain percentage of the fair market value that is determined by local assessors to be the total taxable value of land and additions on the property. | Land | Improvement |
|---|---|---|---|---|
| 2025 | $1,014 | $83,210 | $17,910 | $65,300 |
| 2024 | $1,014 | $88,250 | $9,680 | $78,570 |
| 2023 | $1,124 | $77,665 | $9,680 | $67,985 |
| 2022 | $1,276 | $77,665 | $9,680 | $67,985 |
| 2021 | $923 | $53,330 | $9,680 | $43,650 |
| 2020 | $936 | $53,990 | $9,680 | $44,310 |
| 2019 | $822 | $47,890 | $4,950 | $42,940 |
| 2018 | $825 | $47,890 | $4,950 | $42,940 |
| 2017 | $829 | $47,890 | $4,950 | $42,940 |
| 2016 | $578 | $33,260 | $4,950 | $28,310 |
| 2015 | $621 | $33,260 | $4,950 | $28,310 |
| 2014 | $645 | $33,260 | $4,950 | $28,310 |
| 2012 | $248 | $23,650 | $4,950 | $18,700 |
Source: Public Records
Map
Nearby Homes