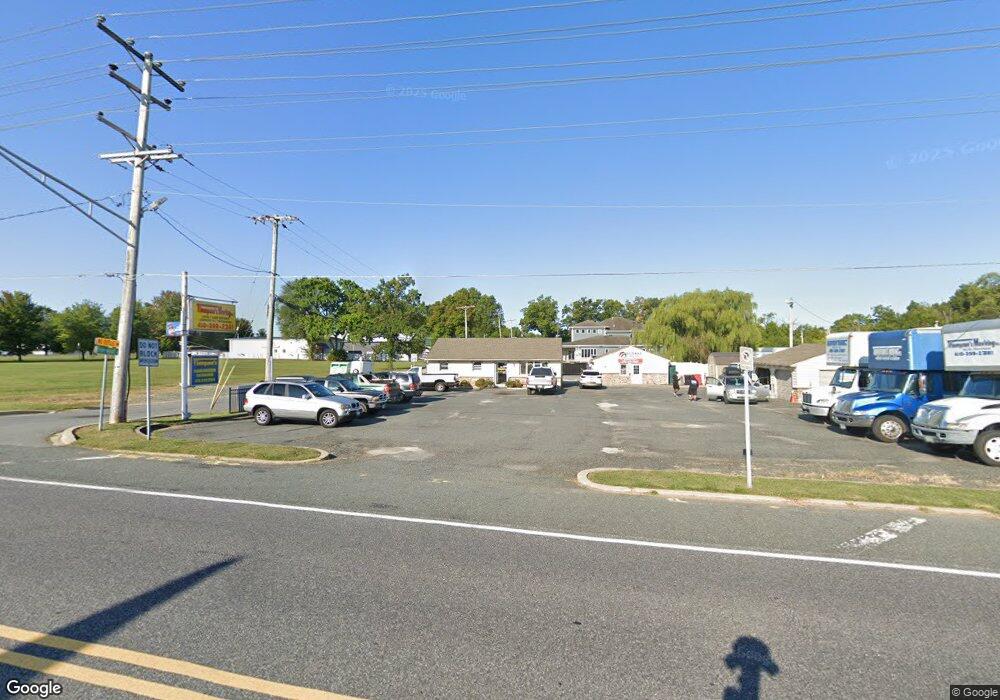
1702 Conowingo Rd Bel Air, MD 21014
Estimated Value: $796,025
--
Bed
--
Bath
936
Sq Ft
$850/Sq Ft
Est. Value
About This Home
This home is located at 1702 Conowingo Rd, Bel Air, MD 21014 and is currently estimated at $796,025, approximately $850 per square foot. 1702 Conowingo Rd is a home located in Harford County with nearby schools including Hickory Elementary School, Southampton Middle School, and C. Milton Wright High School.
Ownership History
Date
Name
Owned For
Owner Type
Purchase Details
Closed on
Jun 16, 2016
Sold by
Castlebridge Properties Llc
Bought by
Thompsons Moving Inc
Current Estimated Value
Home Financials for this Owner
Home Financials are based on the most recent Mortgage that was taken out on this home.
Original Mortgage
$420,000
Outstanding Balance
$334,382
Interest Rate
3.58%
Mortgage Type
Commercial
Estimated Equity
$461,643
Purchase Details
Closed on
Dec 16, 2009
Sold by
Griffiths James D
Bought by
Castlebridge Properties Llc
Purchase Details
Closed on
Apr 18, 2001
Sold by
Griffiths James D
Bought by
Griffiths James D and Griffiths Dorothy Mary
Purchase Details
Closed on
Oct 15, 1987
Sold by
Kahoe William J
Bought by
Griffiths James D
Home Financials for this Owner
Home Financials are based on the most recent Mortgage that was taken out on this home.
Original Mortgage
$125,000
Interest Rate
11.21%
Create a Home Valuation Report for This Property
The Home Valuation Report is an in-depth analysis detailing your home's value as well as a comparison with similar homes in the area
Home Values in the Area
Average Home Value in this Area
Purchase History
| Date | Buyer | Sale Price | Title Company |
|---|---|---|---|
| Thompsons Moving Inc | $525,000 | Attorney | |
| Castlebridge Properties Llc | $500,000 | -- | |
| Griffiths James D | -- | -- | |
| Griffiths James D | $125,000 | -- |
Source: Public Records
Mortgage History
| Date | Status | Borrower | Loan Amount |
|---|---|---|---|
| Open | Thompsons Moving Inc | $420,000 | |
| Previous Owner | Griffiths James D | $125,000 |
Source: Public Records
Tax History Compared to Growth
Tax History
| Year | Tax Paid | Tax Assessment Tax Assessment Total Assessment is a certain percentage of the fair market value that is determined by local assessors to be the total taxable value of land and additions on the property. | Land | Improvement |
|---|---|---|---|---|
| 2025 | $6,922 | $635,300 | $592,800 | $42,500 |
| 2024 | $6,922 | $635,133 | $0 | $0 |
| 2023 | $6,921 | $634,967 | $0 | $0 |
| 2022 | $6,919 | $634,800 | $592,800 | $42,000 |
| 2021 | $3,654 | $634,067 | $0 | $0 |
| 2020 | $3,654 | $633,333 | $0 | $0 |
| 2019 | $7,300 | $632,600 | $592,800 | $39,800 |
| 2018 | $7,226 | $631,867 | $0 | $0 |
| 2017 | $7,218 | $632,600 | $0 | $0 |
| 2016 | $70 | $630,400 | $0 | $0 |
| 2015 | $11,424 | $603,600 | $0 | $0 |
| 2014 | $11,424 | $576,800 | $0 | $0 |
Source: Public Records
Map
Nearby Homes
- 430 Underwood Ln
- 402 Underwood Cir
- 1420 Roman Ridge Way
- 332 Ponfield Rd E
- 218 Aster Ln
- 732 Hickory Limb Cir
- 1239 Whispering Woods Way
- 1006 Saddleback Way
- 1011 Saddleback Way
- 1405 Kahoe Rd
- 310 Willrich Cir
- 1227 Hickory Brook Ct
- 1504 Oakville Ct
- 245 Bynum Ridge Rd
- 243 Bynum Ridge Rd
- 1208 Saddleback Way
- 253 Trudy Ct
- 2229-A Ady Rd
- 2103 Mardic Dr
- 275 Spencer Cir
- 526 Underwood Ln
- 1704 Conowingo Rd
- 527 Underwood Ln
- 1705 Conowingo Rd
- 525 Underwood Ln
- 630A E West Hwy
- 522 Underwood Ln
- 523 Underwood Ln
- 521 Underwood Ln
- 1610 Conowingo Rd
- 1711 Conowingo Rd
- 528 Pritt Ln
- 526 Pritt Ln
- 420 Underwood Ln
- 432 Underwood Ln
- 442 Underwood Cir
- 606 Hoagie Dr
- 522 Pritt Ln
- 434 Underwood Cir
- 520 Pritt Ln