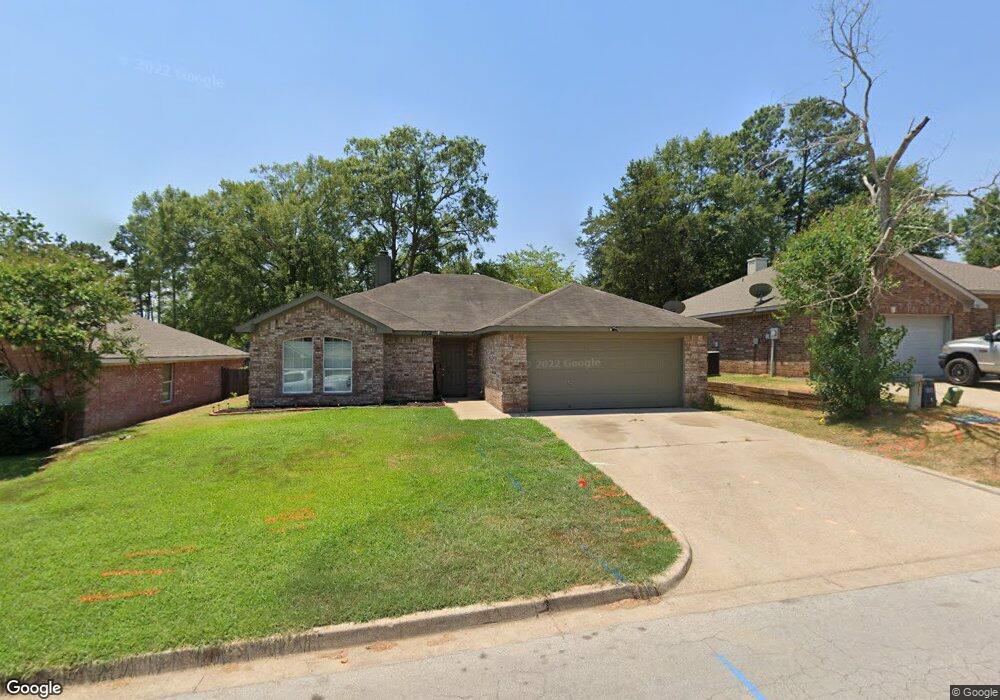
1702 Emily Ln Kilgore, TX 75662
Estimated Value: $234,000 - $249,000
--
Bed
--
Bath
1,596
Sq Ft
$150/Sq Ft
Est. Value
About This Home
This home is located at 1702 Emily Ln, Kilgore, TX 75662 and is currently estimated at $238,625, approximately $149 per square foot. 1702 Emily Ln is a home located in Rusk County with nearby schools including Kilgore Primary School, Chandler Elementary School, and Kilgore Intermediate School.
Ownership History
Date
Name
Owned For
Owner Type
Purchase Details
Closed on
Jul 18, 2014
Sold by
Davis David and Davis Brandy
Bought by
Boykin Byron and Boykin Khristina
Current Estimated Value
Home Financials for this Owner
Home Financials are based on the most recent Mortgage that was taken out on this home.
Original Mortgage
$130,000
Interest Rate
4.19%
Mortgage Type
Purchase Money Mortgage
Purchase Details
Closed on
Nov 14, 2011
Sold by
Adams Andrew and Adams Kathy
Bought by
Davis David
Home Financials for this Owner
Home Financials are based on the most recent Mortgage that was taken out on this home.
Original Mortgage
$127,551
Interest Rate
3.99%
Purchase Details
Closed on
Jul 20, 2005
Sold by
Pike Chris and Pike Kristin
Bought by
Adams Andrew and Adams Kathy
Home Financials for this Owner
Home Financials are based on the most recent Mortgage that was taken out on this home.
Original Mortgage
$91,200
Interest Rate
1.62%
Mortgage Type
Adjustable Rate Mortgage/ARM
Create a Home Valuation Report for This Property
The Home Valuation Report is an in-depth analysis detailing your home's value as well as a comparison with similar homes in the area
Home Values in the Area
Average Home Value in this Area
Purchase History
| Date | Buyer | Sale Price | Title Company |
|---|---|---|---|
| Boykin Byron | -- | None Available | |
| Davis David | -- | -- | |
| Adams Andrew | -- | -- |
Source: Public Records
Mortgage History
| Date | Status | Borrower | Loan Amount |
|---|---|---|---|
| Closed | Boykin Byron | $130,000 | |
| Previous Owner | Davis David | $127,551 | |
| Previous Owner | Adams Andrew | $91,200 |
Source: Public Records
Tax History Compared to Growth
Tax History
| Year | Tax Paid | Tax Assessment Tax Assessment Total Assessment is a certain percentage of the fair market value that is determined by local assessors to be the total taxable value of land and additions on the property. | Land | Improvement |
|---|---|---|---|---|
| 2024 | $5,099 | $206,190 | $30,000 | $176,190 |
| 2023 | $4,565 | $199,040 | $30,000 | $169,040 |
| 2022 | $4,590 | $176,950 | $30,000 | $146,950 |
| 2021 | $3,895 | $153,380 | $30,000 | $123,380 |
| 2020 | $3,643 | $143,380 | $20,000 | $123,380 |
| 2019 | $3,685 | $148,300 | $20,000 | $128,300 |
| 2018 | $3,770 | $141,440 | $20,000 | $121,440 |
| 2017 | $3,677 | $142,850 | $20,000 | $122,850 |
| 2016 | $3,714 | $144,270 | $20,000 | $124,270 |
| 2015 | -- | $145,670 | $20,000 | $125,670 |
| 2014 | -- | $137,310 | $20,000 | $117,310 |
Source: Public Records
Map
Nearby Homes
- 1616 Amanda Ln
- 1612 E Leach
- 1203 Penny Ln
- 1501 Remington Ct
- 1404 Leach St
- 3302 Forrest St
- TBD U S 259
- 2215 Redbud St
- 3584 Cr 195d
- 908 Camp St
- 1115 Roy St
- 2002 Laura Lee Ln
- 2509 Broadway Blvd
- 718 Bean Ave
- 2419 Broadway Blvd
- 2707 Dudley Rd
- 3360 Farm-To-market 1249
- 1505 Dudley Dr
- 632 Leach St
- 624 Camp St