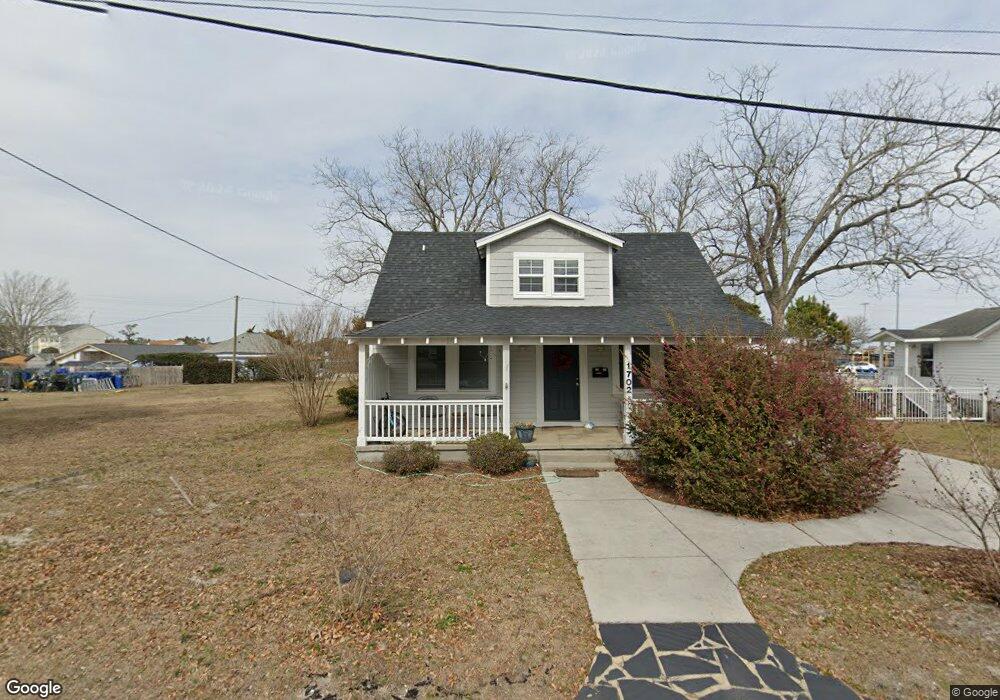
1702 Fisher St Morehead City, NC 28557
Estimated Value: $305,000 - $341,000
3
Beds
1
Bath
1,500
Sq Ft
$218/Sq Ft
Est. Value
About This Home
This home is located at 1702 Fisher St, Morehead City, NC 28557 and is currently estimated at $327,378, approximately $218 per square foot. 1702 Fisher St is a home located in Carteret County with nearby schools including Morehead City Primary School, Morehead Elementary School at Camp Glenn, and Morehead City Middle School.
Ownership History
Date
Name
Owned For
Owner Type
Purchase Details
Closed on
Sep 29, 2006
Sold by
Eagles & Beaver Partnership Llc
Bought by
Beaver Chad and Beaver Janet
Current Estimated Value
Home Financials for this Owner
Home Financials are based on the most recent Mortgage that was taken out on this home.
Original Mortgage
$173,583
Outstanding Balance
$103,580
Interest Rate
6.46%
Mortgage Type
Unknown
Estimated Equity
$223,798
Purchase Details
Closed on
Jan 30, 2006
Sold by
Mcelmurray Helen B and Mcelmurray Claude
Bought by
Eagles & Beaver Partnership Llc
Create a Home Valuation Report for This Property
The Home Valuation Report is an in-depth analysis detailing your home's value as well as a comparison with similar homes in the area
Home Values in the Area
Average Home Value in this Area
Purchase History
| Date | Buyer | Sale Price | Title Company |
|---|---|---|---|
| Beaver Chad | $96,500 | None Available | |
| Eagles & Beaver Partnership Llc | $105,000 | None Available |
Source: Public Records
Mortgage History
| Date | Status | Borrower | Loan Amount |
|---|---|---|---|
| Open | Beaver Chad | $173,583 |
Source: Public Records
Tax History Compared to Growth
Tax History
| Year | Tax Paid | Tax Assessment Tax Assessment Total Assessment is a certain percentage of the fair market value that is determined by local assessors to be the total taxable value of land and additions on the property. | Land | Improvement |
|---|---|---|---|---|
| 2025 | $2,461 | $416,463 | $134,285 | $282,178 |
| 2024 | $1,161 | $141,789 | $69,187 | $72,602 |
| 2023 | $497 | $141,789 | $69,187 | $72,602 |
| 2022 | $483 | $141,789 | $69,187 | $72,602 |
| 2021 | $0 | $141,789 | $69,187 | $72,602 |
| 2020 | $483 | $141,789 | $69,187 | $72,602 |
| 2019 | $484 | $151,302 | $69,187 | $82,115 |
| 2017 | $484 | $151,302 | $69,187 | $82,115 |
| 2016 | $484 | $151,302 | $69,187 | $82,115 |
| 2015 | $469 | $151,302 | $69,187 | $82,115 |
| 2014 | $474 | $152,838 | $70,615 | $82,223 |
Source: Public Records
Map
Nearby Homes