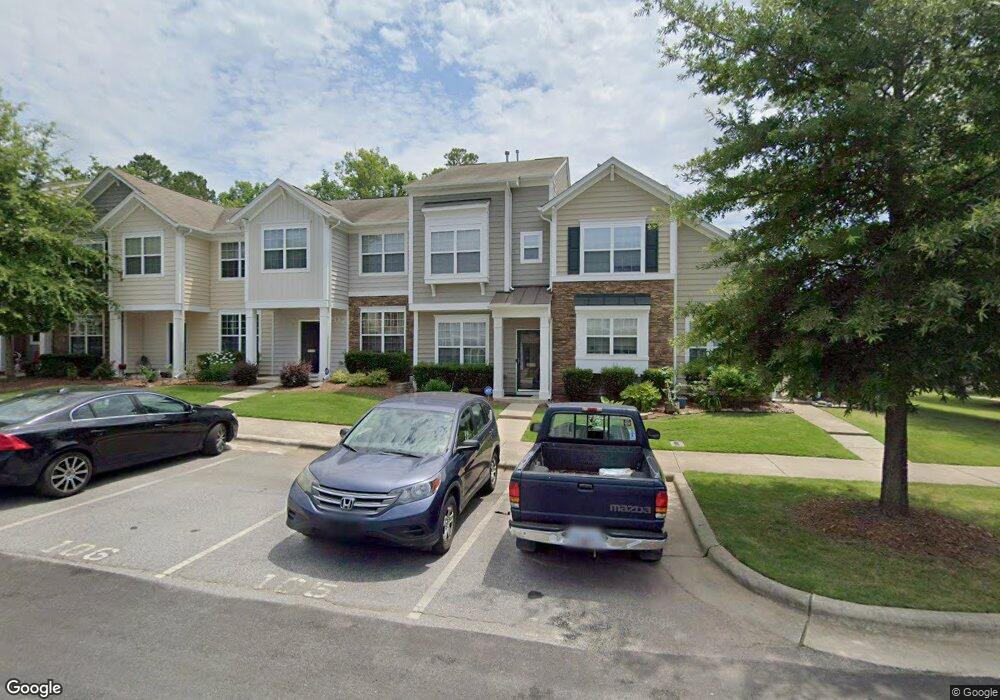
1702 Grace Point Rd Unit 106 Morrisville, NC 27560
Estimated Value: $333,000 - $346,152
2
Beds
3
Baths
1,587
Sq Ft
$213/Sq Ft
Est. Value
About This Home
This home is located at 1702 Grace Point Rd Unit 106, Morrisville, NC 27560 and is currently estimated at $338,288, approximately $213 per square foot. 1702 Grace Point Rd Unit 106 is a home located in Wake County with nearby schools including Parkside Elementary School, Alston Ridge Middle School, and Panther Creek High School.
Ownership History
Date
Name
Owned For
Owner Type
Purchase Details
Closed on
Aug 6, 2020
Sold by
Wen
Bought by
Lyons Diane
Current Estimated Value
Home Financials for this Owner
Home Financials are based on the most recent Mortgage that was taken out on this home.
Original Mortgage
$183,200
Outstanding Balance
$97,153
Interest Rate
3.1%
Mortgage Type
New Conventional
Estimated Equity
$241,135
Purchase Details
Closed on
Jan 14, 2015
Sold by
Odom Michael Lake and Odom Margaret Barham
Bought by
Wen Wen
Home Financials for this Owner
Home Financials are based on the most recent Mortgage that was taken out on this home.
Original Mortgage
$126,000
Interest Rate
3.98%
Mortgage Type
New Conventional
Purchase Details
Closed on
Sep 25, 2009
Sold by
Standard Pacific Of The Carolinas Llc
Bought by
Barham Margaret
Home Financials for this Owner
Home Financials are based on the most recent Mortgage that was taken out on this home.
Original Mortgage
$157,793
Interest Rate
5.22%
Mortgage Type
FHA
Create a Home Valuation Report for This Property
The Home Valuation Report is an in-depth analysis detailing your home's value as well as a comparison with similar homes in the area
Home Values in the Area
Average Home Value in this Area
Purchase History
| Date | Buyer | Sale Price | Title Company |
|---|---|---|---|
| Lyons Diane | $229,000 | None Available | |
| Wen Wen | $158,000 | None Available | |
| Barham Margaret | $161,000 | None Available |
Source: Public Records
Mortgage History
| Date | Status | Borrower | Loan Amount |
|---|---|---|---|
| Open | Lyons Diane | $183,200 | |
| Previous Owner | Wen Wen | $126,000 | |
| Previous Owner | Barham Margaret | $157,793 |
Source: Public Records
Tax History Compared to Growth
Tax History
| Year | Tax Paid | Tax Assessment Tax Assessment Total Assessment is a certain percentage of the fair market value that is determined by local assessors to be the total taxable value of land and additions on the property. | Land | Improvement |
|---|---|---|---|---|
| 2025 | $3,145 | $357,509 | $95,000 | $262,509 |
| 2024 | $3,132 | $357,509 | $95,000 | $262,509 |
| 2023 | $2,461 | $233,146 | $63,000 | $170,146 |
| 2022 | $2,374 | $233,146 | $63,000 | $170,146 |
| 2021 | $2,271 | $233,146 | $63,000 | $170,146 |
| 2020 | $2,258 | $233,146 | $63,000 | $170,146 |
| 2019 | $1,948 | $172,426 | $42,000 | $130,426 |
| 2018 | $1,833 | $172,426 | $42,000 | $130,426 |
| 2017 | $1,765 | $172,426 | $42,000 | $130,426 |
| 2016 | $1,728 | $180,426 | $50,000 | $130,426 |
| 2015 | $1,761 | $169,922 | $36,000 | $133,922 |
| 2014 | $1,677 | $169,922 | $36,000 | $133,922 |
Source: Public Records
Map
Nearby Homes
- 401 Stockton Gorge Rd
- 309 Colwick Ln
- 421 Hamlet Park Dr
- 2032 Kirkhaven Rd
- 1135 Forest Willow Ln
- 101 Hamlet Park Dr
- 2205 Kirkhaven Rd
- 2108 Junewood Ln
- 0 Lot 2 Church St
- 0 Lot 1 Church St
- 0 Lot 5 Church St
- 0 Lot 6 Church St
- 0 Lot 4 Church St
- 508 Durants Neck Ln
- 1025 Historic Cir
- 1404 Legendary Ln
- 204 Concordia Woods Dr
- 1004 Governess Ln
- 142 Brentfield Loop
- 605 Courthouse Dr
- 1702 Grace Point Rd
- 1704 Grace Point Rd
- 1700 Grace Point Rd
- 1706 Grace Point Rd
- 1708 Grace Point Rd
- 1708 Grace Point Rd Unit 109
- 1710 Grace Point Rd Unit 110
- 1712 Grace Point Rd
- 1712 Grace Point Rd Unit 111
- 1412 Grace Point Rd
- 1412 Grace Point Rd Unit 104
- 1701 Grace Point Rd
- 1701 Grace Point Rd Unit 62
- 1410 Grace Point Rd
- 1410 Grace Point Rd Unit 103
- 1703 Grace Point Rd
- 1703 Grace Point Rd Unit 61
- 1705 Grace Point Rd
- 1705 Grace Point Rd Unit 60
- 1707 Grace Point Rd