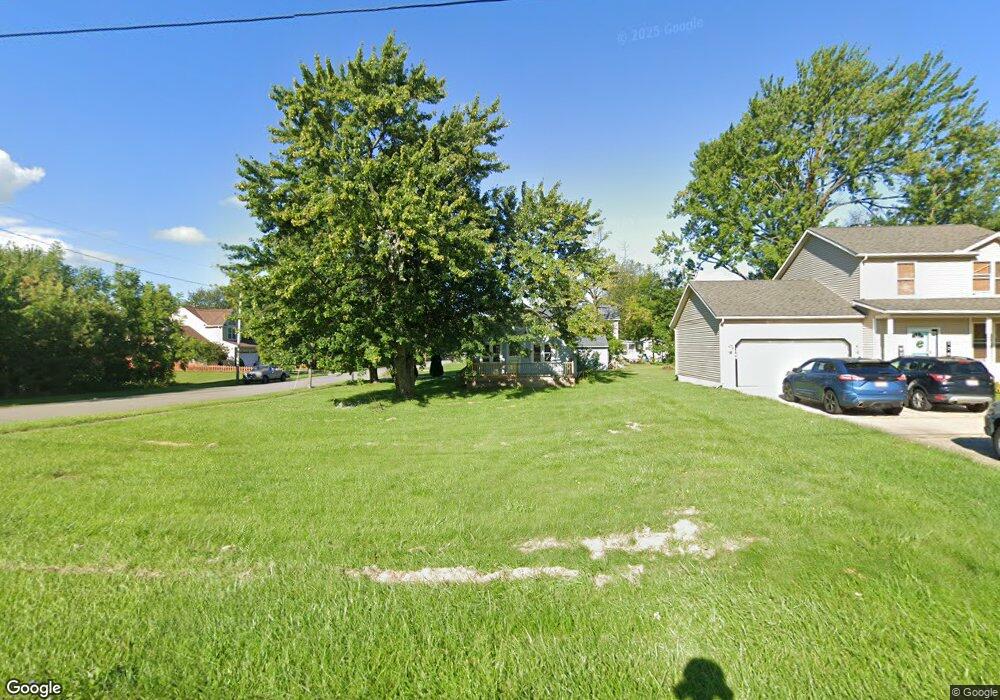
1702 Lorain Blvd Elyria, OH 44035
Estimated Value: $118,000 - $151,000
2
Beds
2
Baths
888
Sq Ft
$148/Sq Ft
Est. Value
About This Home
This home is located at 1702 Lorain Blvd, Elyria, OH 44035 and is currently estimated at $131,761, approximately $148 per square foot. 1702 Lorain Blvd is a home located in Lorain County with nearby schools including Crestwood Elementary School, Westwood Middle School, and Elyria High School.
Ownership History
Date
Name
Owned For
Owner Type
Purchase Details
Closed on
Jan 26, 2010
Sold by
Mccarthy Adam
Bought by
Brunner Lindsey M
Current Estimated Value
Home Financials for this Owner
Home Financials are based on the most recent Mortgage that was taken out on this home.
Original Mortgage
$63,822
Outstanding Balance
$43,221
Interest Rate
5.5%
Mortgage Type
FHA
Estimated Equity
$88,540
Purchase Details
Closed on
Sep 25, 2009
Sold by
Ferner Judy A and Ferner William A
Bought by
Mccarthy Adam
Purchase Details
Closed on
Sep 14, 2009
Sold by
Bender Dennis and Bender Cindy L
Bought by
Mccarthy Adam
Purchase Details
Closed on
Dec 30, 2004
Sold by
Harris Johnny W
Bought by
Bender Dennis and Bender Cindy L
Purchase Details
Closed on
Apr 16, 2004
Sold by
Cook Richard E
Bought by
Harris Johnny W and Harris Enterprises
Create a Home Valuation Report for This Property
The Home Valuation Report is an in-depth analysis detailing your home's value as well as a comparison with similar homes in the area
Home Values in the Area
Average Home Value in this Area
Purchase History
| Date | Buyer | Sale Price | Title Company |
|---|---|---|---|
| Brunner Lindsey M | $65,000 | Chicago Title Insurance Co | |
| Mccarthy Adam | -- | Attorney | |
| Mccarthy Adam | $20,000 | Chicago Title Insurance Co | |
| Bender Dennis | $32,000 | Elyria Land Title | |
| Harris Johnny W | $25,000 | Elyria Land Title |
Source: Public Records
Mortgage History
| Date | Status | Borrower | Loan Amount |
|---|---|---|---|
| Open | Brunner Lindsey M | $63,822 |
Source: Public Records
Tax History
| Year | Tax Paid | Tax Assessment Tax Assessment Total Assessment is a certain percentage of the fair market value that is determined by local assessors to be the total taxable value of land and additions on the property. | Land | Improvement |
|---|---|---|---|---|
| 2024 | $1,467 | $30,254 | $4,396 | $25,858 |
| 2023 | $1,227 | $21,966 | $3,000 | $18,967 |
| 2022 | $1,222 | $21,966 | $3,000 | $18,967 |
| 2021 | $1,225 | $21,966 | $3,000 | $18,967 |
| 2020 | $1,137 | $18,140 | $2,480 | $15,660 |
| 2019 | $1,131 | $18,140 | $2,480 | $15,660 |
| 2018 | $1,133 | $18,140 | $2,480 | $15,660 |
| 2017 | $1,079 | $16,570 | $2,350 | $14,220 |
| 2016 | $1,066 | $16,570 | $2,350 | $14,220 |
| 2015 | $1,000 | $16,570 | $2,350 | $14,220 |
| 2014 | $988 | $16,570 | $2,350 | $14,220 |
| 2013 | $980 | $16,570 | $2,350 | $14,220 |
Source: Public Records
Map
Nearby Homes
- 211 Brace Ave
- 401 Louisiana Ave
- 320 Hayes Ave
- 77 King St
- 161 High St
- 348 Robin Dr
- 132 Warden Ave
- 133 Sheriff St
- 827 Bond St
- 807 Woodland Ave
- 0 Lake Ave
- 950 W River Rd N
- 1201 W River Rd N Unit B3
- 504 Furnace St
- 148 Oak St
- 1207 W River Rd N Unit D3
- 130 Taft Ave
- 119 Erie St
- 747 W River Rd N
- 1028 Foster Ave
- 1706 Lorain Blvd
- 374 Parmely Ave
- 1718 Lorain Blvd
- 377 Parmely Ave
- 363 Warden Ave Unit 1
- 361 Warden Ave
- 357 Warden Ave
- 373 Parmely Ave
- 362 Parmely Ave
- 351 Warden Ave
- 363 Parmely Ave
- 1000 Lorain Blvd
- 361 Parmely Ave
- 347 Warden Ave
- 374 Brace Ave
- 356 Parmely Ave
- 370 Brace Ave
- 357 Parmely Ave
- 1724 Lorain Blvd
- 366 Brace Ave
Your Personal Tour Guide
Ask me questions while you tour the home.