Estimated Value: $709,000
--
Bed
8
Baths
7,560
Sq Ft
$94/Sq Ft
Est. Value
About This Home
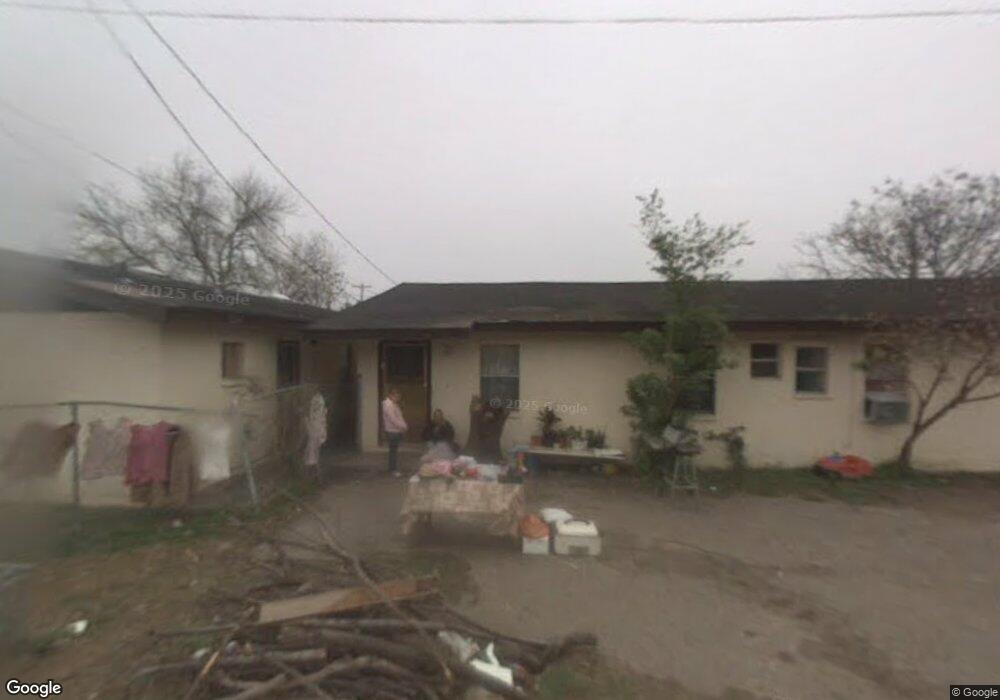
This home is located at 1702 Silver Ave, Donna, TX 78537 and is currently estimated at $709,000, approximately $93 per square foot. 1702 Silver Ave is a home with nearby schools including Guzman Elementary School, W.A. Todd Middle School, and Donna High School.
Ownership History
Date
Name
Owned For
Owner Type
Purchase Details
Closed on
Jan 10, 2019
Sold by
Suplaban Zidan E and Suplaban Sandra K
Bought by
Falcon & Sons Inc
Current Estimated Value
Home Financials for this Owner
Home Financials are based on the most recent Mortgage that was taken out on this home.
Original Mortgage
$155,000
Outstanding Balance
$98,997
Interest Rate
4.6%
Mortgage Type
Seller Take Back
Estimated Equity
$610,003
Purchase Details
Closed on
Feb 28, 2011
Sold by
Kano & Jera Enterprises Inc
Bought by
Suplaban Zidan and Suplaban Sandra
Create a Home Valuation Report for This Property
The Home Valuation Report is an in-depth analysis detailing your home's value as well as a comparison with similar homes in the area
Home Values in the Area
Average Home Value in this Area
Purchase History
| Date | Buyer | Sale Price | Title Company |
|---|---|---|---|
| Falcon & Sons Inc | -- | Sierra Title | |
| Suplaban Zidan | -- | Vltc |
Source: Public Records
Mortgage History
| Date | Status | Borrower | Loan Amount |
|---|---|---|---|
| Open | Falcon & Sons Inc | $155,000 |
Source: Public Records
Tax History Compared to Growth
Tax History
| Year | Tax Paid | Tax Assessment Tax Assessment Total Assessment is a certain percentage of the fair market value that is determined by local assessors to be the total taxable value of land and additions on the property. | Land | Improvement |
|---|---|---|---|---|
| 2025 | $7,502 | $375,000 | $107,427 | $267,573 |
| 2024 | $7,502 | $374,871 | $83,063 | $291,808 |
| 2023 | $9,861 | $374,871 | $83,063 | $291,808 |
| 2022 | $8,338 | $300,859 | $83,063 | $217,796 |
| 2021 | $6,895 | $244,450 | $83,063 | $161,387 |
| 2020 | $6,972 | $238,912 | $77,525 | $161,387 |
| 2019 | $6,087 | $205,687 | $44,300 | $161,387 |
| 2018 | $5,928 | $199,856 | $44,300 | $155,556 |
| 2017 | $6,836 | $216,295 | $44,300 | $171,995 |
| 2016 | $4,853 | $153,563 | $44,854 | $108,709 |
| 2015 | $3,108 | $153,563 | $44,854 | $108,709 |
| 2014 | $3,108 | $142,713 | $44,854 | $97,859 |
Source: Public Records
Map
Nearby Homes