Estimated Value: $115,000 - $163,000
3
Beds
1
Bath
999
Sq Ft
$150/Sq Ft
Est. Value
About This Home
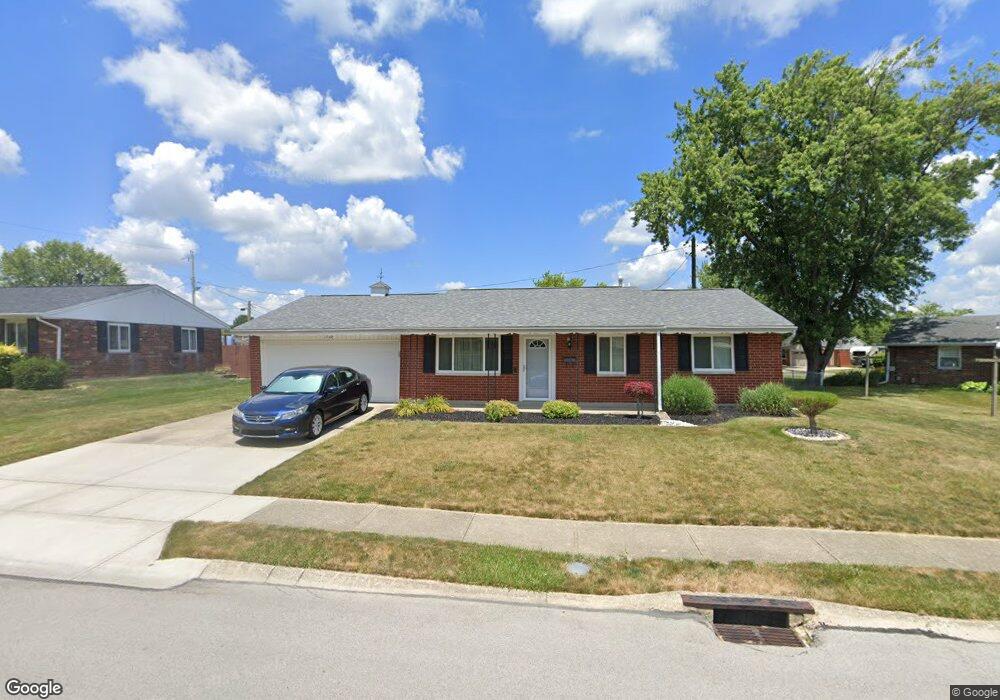
This home is located at 1702 Williams Place, Piqua, OH 45356 and is currently estimated at $149,536, approximately $149 per square foot. 1702 Williams Place is a home located in Miami County with nearby schools including Washington Primary School, Piqua Junior High School, and Piqua High School.
Ownership History
Date
Name
Owned For
Owner Type
Purchase Details
Closed on
Jun 22, 2016
Sold by
Grove April R
Bought by
Grove Martin S
Current Estimated Value
Purchase Details
Closed on
Nov 7, 2012
Sold by
Exley Christy
Bought by
Bank Of America Na
Purchase Details
Closed on
Oct 25, 2012
Sold by
Exley Christy and Exley Christy S
Bought by
Bank Of America Na
Purchase Details
Closed on
Feb 13, 2007
Sold by
Friend Dale F and Friend Mary C
Bought by
Exley Christy S
Home Financials for this Owner
Home Financials are based on the most recent Mortgage that was taken out on this home.
Original Mortgage
$96,239
Interest Rate
6.23%
Mortgage Type
FHA
Purchase Details
Closed on
Jun 2, 1995
Sold by
Sherman Catherine M
Bought by
Friend Dale F and Friend Mary C
Create a Home Valuation Report for This Property
The Home Valuation Report is an in-depth analysis detailing your home's value as well as a comparison with similar homes in the area
Home Values in the Area
Average Home Value in this Area
Purchase History
| Date | Buyer | Sale Price | Title Company |
|---|---|---|---|
| Grove Martin S | -- | Attorney | |
| Bank Of America Na | $46,000 | Attorney | |
| Bank Of America Na | $46,000 | None Available | |
| Exley Christy S | $97,000 | -- | |
| Friend Dale F | $65,000 | -- |
Source: Public Records
Mortgage History
| Date | Status | Borrower | Loan Amount |
|---|---|---|---|
| Previous Owner | Exley Christy S | $96,239 |
Source: Public Records
Tax History Compared to Growth
Tax History
| Year | Tax Paid | Tax Assessment Tax Assessment Total Assessment is a certain percentage of the fair market value that is determined by local assessors to be the total taxable value of land and additions on the property. | Land | Improvement |
|---|---|---|---|---|
| 2024 | $1,434 | $34,900 | $7,880 | $27,020 |
| 2023 | $1,434 | $34,900 | $7,880 | $27,020 |
| 2022 | $1,459 | $34,900 | $7,880 | $27,020 |
| 2021 | $1,183 | $25,870 | $5,850 | $20,020 |
| 2020 | $1,159 | $25,870 | $5,850 | $20,020 |
| 2019 | $1,165 | $25,870 | $5,850 | $20,020 |
| 2018 | $1,064 | $22,550 | $5,850 | $16,700 |
| 2017 | $1,077 | $22,550 | $5,850 | $16,700 |
| 2016 | $1,065 | $22,550 | $5,850 | $16,700 |
| 2015 | $1,090 | $22,550 | $5,850 | $16,700 |
| 2014 | $1,090 | $22,550 | $5,850 | $16,700 |
| 2013 | $1,125 | $22,550 | $5,850 | $16,700 |
Source: Public Records
Map
Nearby Homes
- 1706 Williams Place
- 809 Candlewood Blvd
- 806 Candlewood Blvd
- 918 Falmouth Ave
- 920 New Haven Rd
- 1715 Dover Ave
- 1725 Dover Ave
- 1505 Amherst Ave
- 1513 Arrowhead Dr
- 1502 Arrowhead Dr
- Ironwood Plan at Arrowhead Estates
- Juniper Plan at Arrowhead Estates
- Spruce Plan at Arrowhead Estates
- Aspen II Plan at Arrowhead Estates
- Norway Plan at Arrowhead Estates
- Palmetto Plan at Arrowhead Estates
- Walnut Plan at Arrowhead Estates
- Ashton Plan at Arrowhead Estates
- Empress Plan at Arrowhead Estates
- Chestnut Plan at Arrowhead Estates
- 1704 Williams Place
- 906 Candlewood Blvd
- 908 Candlewood Blvd
- 904 Candlewood Blvd
- 1707 Williams Place
- 1705 Williams Place
- 1709 Williams Place
- 1703 Williams Place
- 1708 Williams Place
- 1711 Williams Place
- 905 Woodbridge Ct
- 902 Candlewood Blvd
- 903 Candlewood Blvd
- 1701 Williams Place
- 905 Candlewood Blvd
- 1713 Williams Place
- 1706 Cambridge St
- 1704 Cambridge St
- 903 Woodbridge Ct
- 1710 Williams Place