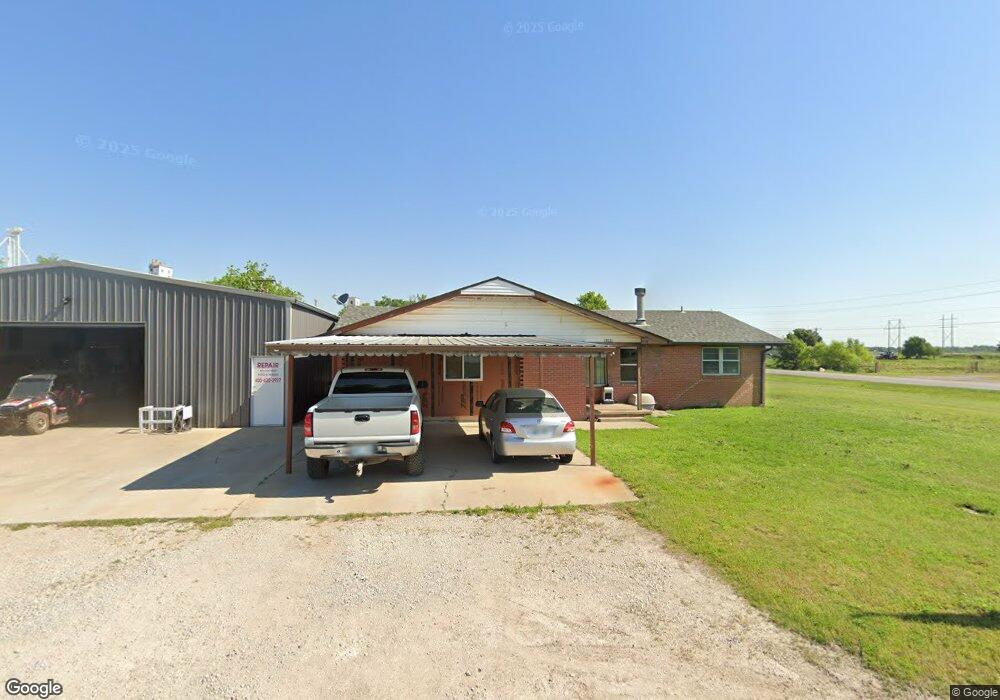
17021 Darren Ave El Reno, OK 73036
Estimated Value: $137,000 - $220,000
3
Beds
2
Baths
1,612
Sq Ft
$116/Sq Ft
Est. Value
About This Home
This home is located at 17021 Darren Ave, El Reno, OK 73036 and is currently estimated at $187,048, approximately $116 per square foot. 17021 Darren Ave is a home located in Canadian County with nearby schools including Banner School.
Ownership History
Date
Name
Owned For
Owner Type
Purchase Details
Closed on
Jun 2, 2022
Sold by
Garcia and Jared
Bought by
Garcia Jared
Current Estimated Value
Purchase Details
Closed on
Aug 3, 2017
Sold by
Morris Larry
Bought by
Garcia Tracy and Garcia Jareo
Purchase Details
Closed on
Nov 20, 2008
Sold by
Secretary Of Housing & Urban Development
Bought by
Morris Larry K
Purchase Details
Closed on
Apr 7, 2008
Sold by
Scott Jason Lee
Bought by
Secretary Of Hud Of Washington Dc
Purchase Details
Closed on
Mar 5, 2003
Sold by
Burgess Ronald Mason and Burgess Susie
Home Financials for this Owner
Home Financials are based on the most recent Mortgage that was taken out on this home.
Original Mortgage
$74,013
Interest Rate
5.86%
Purchase Details
Closed on
Feb 10, 2003
Sold by
Smith Barbara L Burgess-~ and Smith Obbie
Home Financials for this Owner
Home Financials are based on the most recent Mortgage that was taken out on this home.
Original Mortgage
$74,013
Interest Rate
5.86%
Purchase Details
Closed on
Jan 4, 2001
Sold by
Little Darlene
Create a Home Valuation Report for This Property
The Home Valuation Report is an in-depth analysis detailing your home's value as well as a comparison with similar homes in the area
Home Values in the Area
Average Home Value in this Area
Purchase History
| Date | Buyer | Sale Price | Title Company |
|---|---|---|---|
| Garcia Jared | -- | None Listed On Document | |
| Garcia Tracy | $45,000 | None Available | |
| Morris Larry K | -- | Lawyers Title Of Oklahoma Ci | |
| Secretary Of Hud Of Washington Dc | -- | None Available | |
| -- | -- | -- | |
| -- | -- | -- | |
| -- | $75,000 | -- | |
| -- | -- | -- |
Source: Public Records
Mortgage History
| Date | Status | Borrower | Loan Amount |
|---|---|---|---|
| Previous Owner | -- | $74,013 |
Source: Public Records
Tax History Compared to Growth
Tax History
| Year | Tax Paid | Tax Assessment Tax Assessment Total Assessment is a certain percentage of the fair market value that is determined by local assessors to be the total taxable value of land and additions on the property. | Land | Improvement |
|---|---|---|---|---|
| 2024 | $1,160 | $16,694 | $600 | $16,094 |
| 2023 | $1,160 | $16,208 | $600 | $15,608 |
| 2022 | $1,134 | $15,736 | $600 | $15,136 |
| 2021 | $1,105 | $15,278 | $600 | $14,678 |
| 2020 | $1,087 | $15,222 | $600 | $14,622 |
| 2019 | $1,059 | $14,779 | $600 | $14,179 |
| 2018 | $792 | $11,161 | $600 | $10,561 |
| 2017 | $840 | $10,694 | $600 | $10,094 |
| 2016 | $785 | $10,694 | $600 | $10,094 |
| 2015 | $682 | $9,700 | $600 | $9,100 |
| 2014 | $682 | $9,238 | $600 | $8,638 |
Source: Public Records
Map
Nearby Homes
- 11020 N Banner Rd
- 3501 Manning Farms Blvd
- 4160 N Gregory Rd
- 8592 Beth Ln
- 8652 Beth Ln
- 4115 S Manning Rd
- 8384 Rip Way
- 8664 Rip Way
- 8634 Rip Way
- 8604 Rip Way
- 8454 Rip Way
- 8574 Rip Way
- 7145 S Manning Rd
- 4747 Dutton Cir
- 8626 Kayce St
- 8545 Kayce St
- 8625 Kayce St
- 8655 Kayce St
- 8595 Kayce St
- 3550 N Manning Rd
- 17043 Darren Ave
- 17032 Darren Ave
- 4065 N Banner Rd
- 17048 White St
- 3905 N Banner Rd
- 3905 N Banner Rd
- 17064 Darren Ave
- 17067 Darren Ave
- 17088 Darren Ave
- 17051 White St
- 3855 N Banner Rd
- 4115 N Banner Rd
- 17103 Darren Ave
- 4123 N Banner Rd
- 17127 Darren Ave
- 3805 N Banner Rd
- 17164 Darren Ave
- 17143 Darren Ave
- 5 N Banner Rd
- 4076 N Banner Rd