17021 Tyler St Lacona, IA 50139
Warren County NeighborhoodEstimated payment $5,675/month
About This Lot
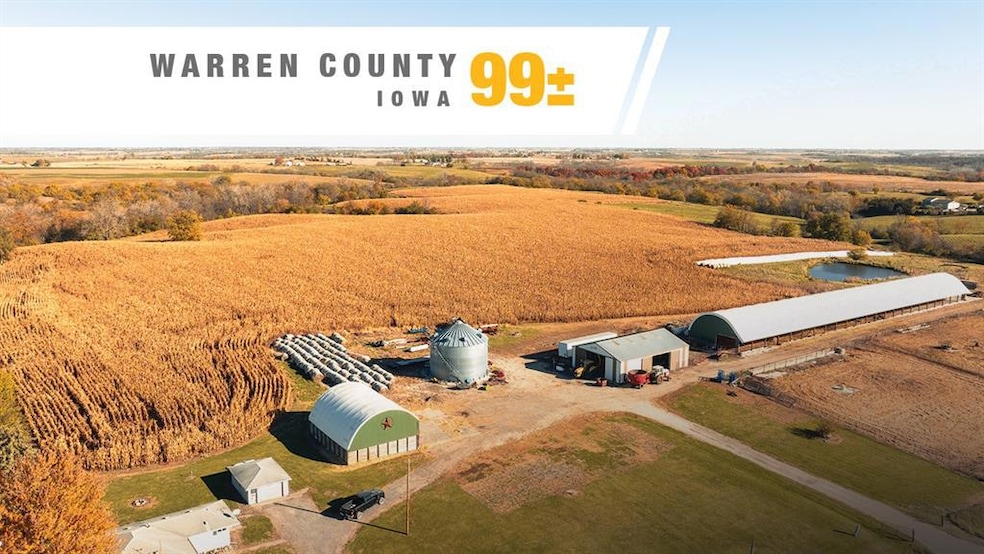
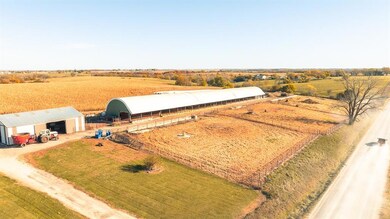
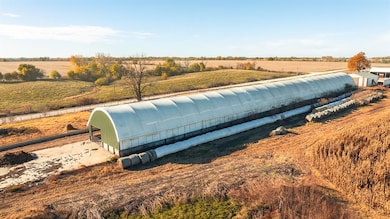
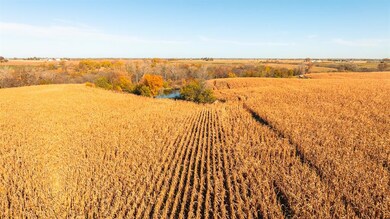
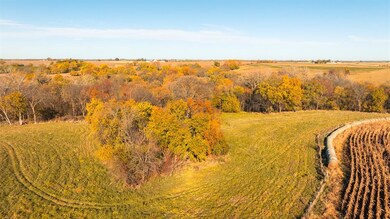
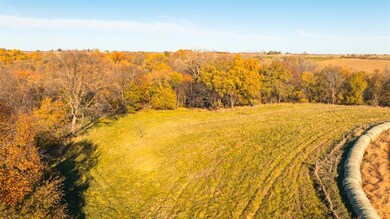
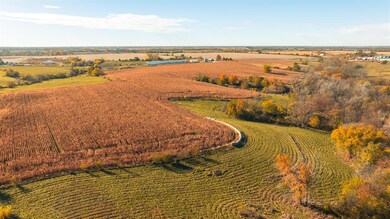
99± Acre Cattle & Grain Farm – Turnkey Beef Operation
?? 17021 Tyler St, Lacona, IA 50139 Exceptional 99± acre cattle and grain farm in southern Warren County featuring 45± tillable acres for crops or hay, with the balance in pasture, recreation, and two ponds. The setup includes a 365’ x 48’ hoop feed building with 7 paddocked lots, 4 automatic waterers, curtain vents, and capacity for 320 head. Additional improvements include a 45’ x 35’ commodity shed, 20,000-bushel Sukup grain bin with dryer, and 42’ x 63’ Morton machine shed. Heavy-duty fencing, concrete pads, and bunks provide a clean, efficient livestock layout. The 1,100± sq. ft. ranch home offers 2 beds, 1 bath, a full basement, and a new septic system — located just one mile off pavement, ideal for an owner-operator or family seeking comfortable country living. A ready-to-go operation blending feedlot, pasture, and tillable acres — built for efficiency and long-term success. Directions: From Lacona, west on Hwy G76 (6.1 mi), north on Hwy 65 (1.5 mi), east on Tyler St (1 mi). Property on left.
Parcels: 1100014066, 1100014069, 11000140640
Property Details
Property Type
- Land
Est. Annual Taxes
- $5,292
Lot Details
- 99 Acre Lot
- Property is zoned Ag
Listing and Financial Details
- Assessor Parcel Number 11000140661
Map
Home Values in the Area
Average Home Value in this Area
Tax History
| Year | Tax Paid | Tax Assessment Tax Assessment Total Assessment is a certain percentage of the fair market value that is determined by local assessors to be the total taxable value of land and additions on the property. | Land | Improvement |
|---|---|---|---|---|
| 2025 | $4,614 | $309,900 | $47,300 | $262,600 |
| 2024 | $4,518 | $286,400 | $34,000 | $252,400 |
| 2023 | $2,964 | $286,400 | $34,000 | $252,400 |
| 2022 | $2,720 | $168,800 | $26,300 | $142,500 |
| 2021 | $2,944 | $171,100 | $28,600 | $142,500 |
| 2020 | $2,944 | $174,400 | $29,800 | $144,600 |
| 2019 | $3,042 | $174,400 | $29,800 | $144,600 |
| 2018 | $3,332 | $0 | $0 | $0 |
| 2017 | $3,482 | $0 | $0 | $0 |
| 2016 | $3,336 | $236,300 | $0 | $0 |
| 2015 | $3,336 | $0 | $0 | $0 |
| 2014 | $3,734 | $274,400 | $0 | $0 |
Property History
| Date | Event | Price | List to Sale | Price per Sq Ft | Prior Sale |
|---|---|---|---|---|---|
| 11/10/2025 11/10/25 | For Sale | $995,000 | 0.0% | -- | |
| 10/31/2024 10/31/24 | Sold | $995,000 | 0.0% | $643 / Sq Ft | View Prior Sale |
| 10/02/2024 10/02/24 | Pending | -- | -- | -- | |
| 10/23/2023 10/23/23 | For Sale | $995,000 | -- | $643 / Sq Ft |
Purchase History
| Date | Type | Sale Price | Title Company |
|---|---|---|---|
| Warranty Deed | $995,000 | None Listed On Document | |
| Warranty Deed | $995,000 | None Listed On Document | |
| Warranty Deed | $453,000 | None Available |
Mortgage History
| Date | Status | Loan Amount | Loan Type |
|---|---|---|---|
| Open | $1,000,000 | Credit Line Revolving | |
| Closed | $1,000,000 | Credit Line Revolving |
Source: Des Moines Area Association of REALTORS®
MLS Number: 730156
APN: 11000140660
Disclaimer: Certain information contained herein is derived from information provided by parties other than Homes.com. All information provided is deemed reliable, but is not guaranteed to be accurate and should be independently verified.
![]() IDX information is provided exclusively for personal, non-commercial use, and may not be used for any purpose other than to identify prospective properties consumers may be interested in purchasing. Information is deemed reliable but not guaranteed.
IDX information is provided exclusively for personal, non-commercial use, and may not be used for any purpose other than to identify prospective properties consumers may be interested in purchasing. Information is deemed reliable but not guaranteed.
- 21276 190th Ave
- 0 Hwy G76 & 190th Ave Unit 722395
- County Road G76
- 23446 148th Ave
- 000 145th Ave
- 150th Avenue
- 18377 Quincy St
- 00 150 Ave
- Tbd 130th Ave
- 0000 120 Ave
- 0000 120th Ave
- 130th Avenue
- 0 Tyler St
- 0000 G76 Ave
- 580 N Central Ave
- 218 S Central Ave
- 17283 S23 Hwy
- 115 N Vine Ave
- 209 S Vine Ave
- 320 E Main St Unit L
- 1203 E 1st Ave
- 1009 E 1st Ave
- 508 W 2nd Ave Unit C
- 1001 W 3rd Ave
- 1203 W 2nd Ave
- 901 S R St
- 813 N 14th St
- 208 S J St
- 1010 W 1st Ave
- 1500 N 9th St
- 1305 N 6th St
- 610 E Scenic Valley Ave
- 1833 Curtis Ave
- 715 Lucas Ave Unit 2
- 1809 Primrose Ln
- 1220 Hardin Dr
- 600-620 John Goodhue Dr
- 421 S Gustin St
- 424 S Gustin St Unit 1
- 840 Bellflower Dr
