R
Seller's Agent in 2021
Robert Mallard
Inheritance Realty Group
(706) 505-7154
1 in this area
8 Total Sales


Estimated Value: $177,000 - $182,000
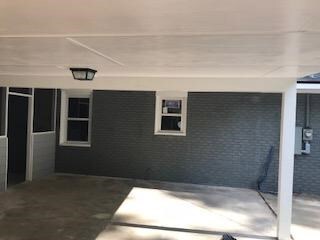
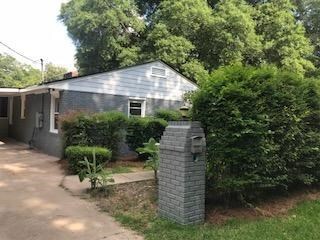
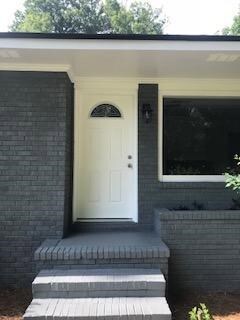
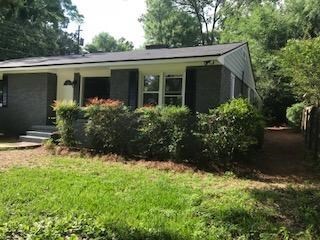
Great Investment Opportunity!!! Turn-key Investment property!!! Unbelievable CAP Rate!!! "A" Property!!! Tenant Occupied!!! Beautiful one story corner lot home features 3 bedrooms 2 Bath. Hardwood Floors throughout. Kitchen has custom tile work and access to a screened and enclosed back porch. Great room has fireplace, open to Dining with lots of sunlight! Cozy Master Suite with custom tiled shower.
Last Agent to Sell the Property
Inheritance Realty Group Brokerage Phone: 7623590317 License #403329 Listed on: 04/23/2021
Last Buyer's Agent
Inheritance Realty Group Brokerage Phone: 7623590317 License #403329 Listed on: 04/23/2021
| Date | Buyer | Sale Price | Title Company |
|---|---|---|---|
| Diversity Suppliers Llc | $135,000 | -- | |
| Sdn Investors Llc | -- | -- | |
| Devi Shazaad Nazir Mohamed | $28,300 | -- | |
| Wells Fargo Bank | $43,890 | -- |
| Date | Status | Borrower | Loan Amount |
|---|---|---|---|
| Open | Diversity Suppliers Llc | $94,500 |
| Date | Event | Price | List to Sale | Price per Sq Ft |
|---|---|---|---|---|
| 08/18/2024 08/18/24 | Off Market | $135,000 | -- | -- |
| 09/16/2021 09/16/21 | Sold | $135,000 | -4.9% | $99 / Sq Ft |
| 09/15/2021 09/15/21 | Pending | -- | -- | -- |
| 04/23/2021 04/23/21 | For Sale | $142,000 | -- | $104 / Sq Ft |
| Year | Tax Paid | Tax Assessment Tax Assessment Total Assessment is a certain percentage of the fair market value that is determined by local assessors to be the total taxable value of land and additions on the property. | Land | Improvement |
|---|---|---|---|---|
| 2025 | $2,545 | $65,024 | $8,264 | $56,760 |
| 2024 | $2,545 | $65,024 | $8,264 | $56,760 |
| 2023 | $2,561 | $65,024 | $8,264 | $56,760 |
| 2022 | $2,155 | $52,788 | $8,264 | $44,524 |
| 2021 | $1,745 | $42,748 | $8,264 | $34,484 |
| 2020 | $1,746 | $42,748 | $8,264 | $34,484 |
| 2019 | $1,209 | $29,508 | $8,264 | $21,244 |
| 2018 | $464 | $11,320 | $2,600 | $8,720 |
| 2017 | $645 | $35,876 | $8,264 | $27,612 |
| 2016 | $649 | $50,757 | $3,557 | $47,200 |
| 2015 | $651 | $50,757 | $3,557 | $47,200 |
| 2014 | $654 | $50,757 | $3,557 | $47,200 |
| 2013 | -- | $50,757 | $3,557 | $47,200 |
R
Seller's Agent in 2021
Robert Mallard
Inheritance Realty Group
(706) 505-7154
1 in this area
8 Total Sales
Source: Columbus Board of REALTORS® (GA)
MLS Number: 185031
APN: 031-034-002
Disclaimer: Certain information contained herein is derived from information provided by parties other than Homes.com. All information provided is deemed reliable, but is not guaranteed to be accurate and should be independently verified.
![]() IDX information is provided exclusively for personal, non-commercial use, and may not be used for any purpose other than to identify prospective properties consumers may be interested in purchasing. Information is deemed reliable but not guaranteed.
IDX information is provided exclusively for personal, non-commercial use, and may not be used for any purpose other than to identify prospective properties consumers may be interested in purchasing. Information is deemed reliable but not guaranteed.
