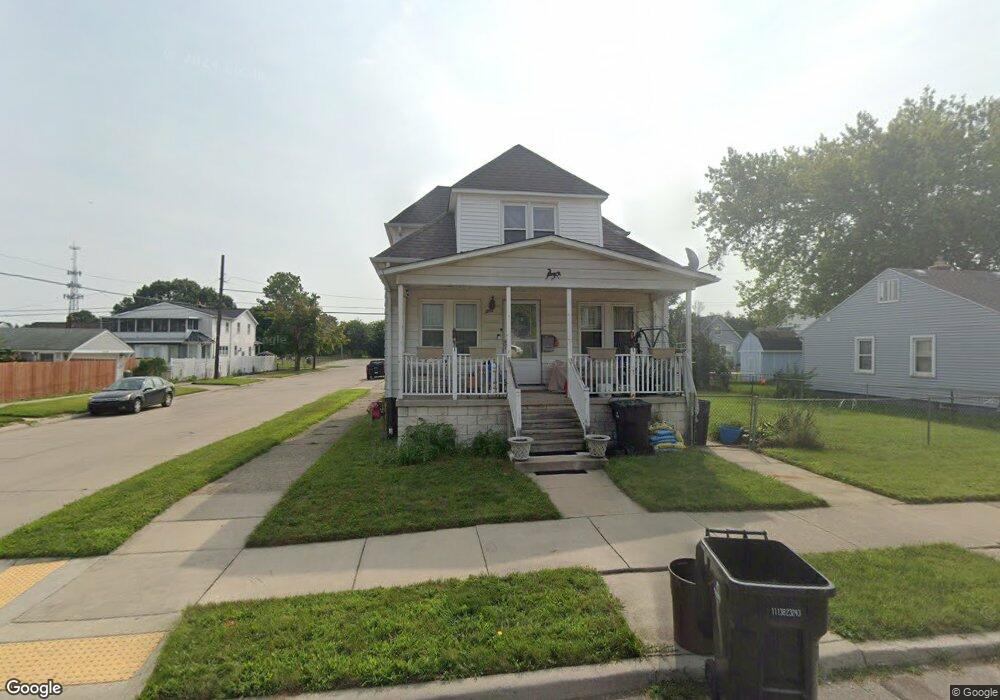
1703 Lindbergh St Wyandotte, MI 48192
Estimated Value: $196,000 - $228,000
3
Beds
2
Baths
1,464
Sq Ft
$143/Sq Ft
Est. Value
About This Home
This home is located at 1703 Lindbergh St, Wyandotte, MI 48192 and is currently estimated at $209,097, approximately $142 per square foot. 1703 Lindbergh St is a home located in Wayne County with nearby schools including Jefferson Elementary School, Woodrow Wilson School, and Roosevelt High School.
Ownership History
Date
Name
Owned For
Owner Type
Purchase Details
Closed on
May 12, 2020
Sold by
Patrick John and Marron Keith B
Bought by
Marron Melvyn and Marron Sarah
Current Estimated Value
Purchase Details
Closed on
Aug 22, 2011
Sold by
Marron Melvyn and Marron Patrick John
Bought by
Marron Melvyn and Marron Patrick John
Purchase Details
Closed on
Jul 14, 2009
Sold by
Donovan Shaun
Bought by
Marron Melvyn
Purchase Details
Closed on
Jan 21, 2009
Sold by
Bank Of New York
Bought by
The Secretary Of Housing & Urban Develop
Purchase Details
Closed on
Jul 24, 2008
Sold by
Mortgage Electronic Registration Systems
Bought by
Bank Of New York and Cwmbs 2004-R2
Purchase Details
Closed on
Jul 16, 2008
Sold by
Gile Kathy
Bought by
Mortgage Electronic Registration Systems
Purchase Details
Closed on
May 24, 2002
Sold by
Vitale Josephine
Bought by
Gile Kathy
Create a Home Valuation Report for This Property
The Home Valuation Report is an in-depth analysis detailing your home's value as well as a comparison with similar homes in the area
Home Values in the Area
Average Home Value in this Area
Purchase History
| Date | Buyer | Sale Price | Title Company |
|---|---|---|---|
| Marron Melvyn | -- | Midstate Title Agency Llc | |
| Marron Melvyn | -- | American Title Agency | |
| Marron Melvyn | $26,009 | None Available | |
| The Secretary Of Housing & Urban Develop | -- | None Available | |
| Bank Of New York | -- | None Available | |
| Mortgage Electronic Registration Systems | $127,963 | None Available | |
| Gile Kathy | $130,000 | -- |
Source: Public Records
Tax History Compared to Growth
Tax History
| Year | Tax Paid | Tax Assessment Tax Assessment Total Assessment is a certain percentage of the fair market value that is determined by local assessors to be the total taxable value of land and additions on the property. | Land | Improvement |
|---|---|---|---|---|
| 2025 | $1,542 | $106,100 | $0 | $0 |
| 2024 | $1,542 | $96,700 | $0 | $0 |
| 2023 | $1,471 | $88,500 | $0 | $0 |
| 2022 | $1,703 | $79,300 | $0 | $0 |
| 2021 | $1,670 | $71,300 | $0 | $0 |
| 2020 | $1,647 | $64,200 | $0 | $0 |
| 2019 | $1,624 | $59,800 | $0 | $0 |
| 2018 | $1,296 | $35,100 | $0 | $0 |
| 2017 | $568 | $35,100 | $0 | $0 |
| 2016 | $2,078 | $31,900 | $0 | $0 |
| 2015 | $2,797 | $29,600 | $0 | $0 |
| 2013 | $2,710 | $27,100 | $0 | $0 |
| 2012 | $1,563 | $28,400 | $7,300 | $21,100 |
Source: Public Records
Map
Nearby Homes
- 1717 Lindbergh St
- 1615 Lindbergh St
- 1727 Lindbergh St
- 1702 6th St
- 1607 Lindbergh St
- 1716 6th St
- 1614 6th St
- 1702 Lindbergh St
- 1710 Lindbergh St
- 1606 6th St
- 1599 Lindbergh St
- 1728 6th St
- 1743 Lindbergh St Unit Bldg-Unit
- 1743 Lindbergh St
- 1614 Lindbergh St
- 1724 Lindbergh St
- 1598 6th St
- 1606 Lindbergh St
- 1593 Lindbergh St
- 1734 Lindbergh St