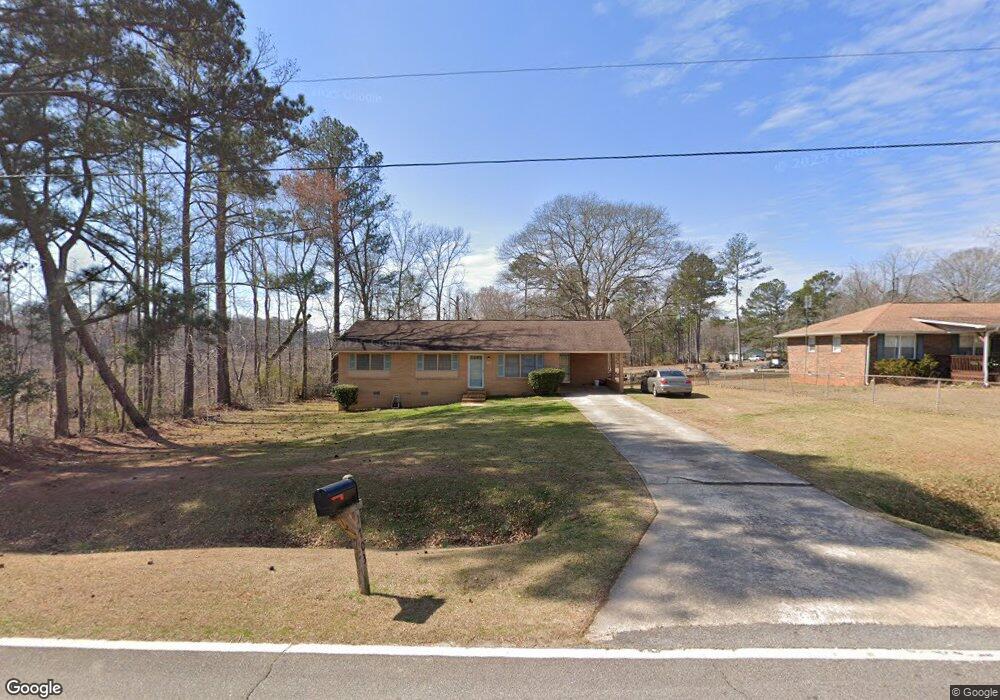
1703 N 2nd Street Extension Griffin, GA 30223
Spalding County NeighborhoodEstimated Value: $165,720 - $203,000
3
Beds
2
Baths
1,367
Sq Ft
$132/Sq Ft
Est. Value
About This Home
This home is located at 1703 N 2nd Street Extension, Griffin, GA 30223 and is currently estimated at $180,180, approximately $131 per square foot. 1703 N 2nd Street Extension is a home located in Spalding County with nearby schools including Jordan Hill Road Elementary School, Kennedy Road Middle School, and Spalding High School.
Ownership History
Date
Name
Owned For
Owner Type
Purchase Details
Closed on
Jul 31, 1998
Sold by
Kimbell John and Kimbell Marilyn
Bought by
Robinson Homer
Current Estimated Value
Home Financials for this Owner
Home Financials are based on the most recent Mortgage that was taken out on this home.
Original Mortgage
$73,625
Outstanding Balance
$15,426
Interest Rate
6.97%
Mortgage Type
New Conventional
Estimated Equity
$164,754
Purchase Details
Closed on
Apr 6, 1984
Sold by
Gentry William L and Gentry Diane
Bought by
Kimbell John A and Kimbell Marilyn G
Purchase Details
Closed on
Oct 9, 1979
Sold by
Lynch James D and Lynch Linda T
Bought by
Gentry William L and Gentry Diane
Purchase Details
Closed on
Jun 12, 1973
Sold by
Nichols John H
Bought by
Lynch James D and Lynch Linda T
Purchase Details
Closed on
Oct 31, 1972
Bought by
Nichols John H
Create a Home Valuation Report for This Property
The Home Valuation Report is an in-depth analysis detailing your home's value as well as a comparison with similar homes in the area
Home Values in the Area
Average Home Value in this Area
Purchase History
| Date | Buyer | Sale Price | Title Company |
|---|---|---|---|
| Robinson Homer | $77,500 | -- | |
| Kimbell John A | $8,700 | -- | |
| Gentry William L | $33,900 | -- | |
| Lynch James D | $23,900 | -- | |
| Nichols John H | -- | -- |
Source: Public Records
Mortgage History
| Date | Status | Borrower | Loan Amount |
|---|---|---|---|
| Open | Robinson Homer | $73,625 |
Source: Public Records
Tax History Compared to Growth
Tax History
| Year | Tax Paid | Tax Assessment Tax Assessment Total Assessment is a certain percentage of the fair market value that is determined by local assessors to be the total taxable value of land and additions on the property. | Land | Improvement |
|---|---|---|---|---|
| 2024 | $994 | $29,600 | $4,000 | $25,600 |
| 2023 | $994 | $29,600 | $4,000 | $25,600 |
| 2022 | $838 | $24,845 | $3,200 | $21,645 |
| 2021 | $759 | $22,695 | $3,200 | $19,495 |
| 2020 | $762 | $22,695 | $3,200 | $19,495 |
| 2019 | $778 | $22,695 | $3,200 | $19,495 |
| 2018 | $723 | $20,720 | $3,200 | $17,520 |
| 2017 | $703 | $20,720 | $3,200 | $17,520 |
| 2016 | $716 | $20,720 | $3,200 | $17,520 |
| 2015 | $738 | $20,720 | $3,200 | $17,520 |
| 2014 | $752 | $20,720 | $3,200 | $17,520 |
Source: Public Records
Map
Nearby Homes
- 204 Custer Cir
- 1881 E Mcintosh Rd
- 583 Hamil Rd
- 1517 Cabin Creek Trail
- 103 Cabin Creek Cir
- 0 Hamil Rd Unit 6.21 AC 10578337
- 1110 N 2nd St
- 55 Smoak Rd
- 113 Crape Myrtle Dr
- 135 Crape Myrtle Dr
- 126 Callie Rd
- 506 Orchid Lights Ct
- 226 English Ivy Dr
- 811 Dusky Sap Ct
- 802 Dusky Sap Ct
- 840 Peach Blossom Ct
- 121 Plumleaf Ct
- 421 Beacon Ct
- 850 Dusky Sap Ct
- 235 Cecil Jackson Rd
- 1717 N 2nd Street Extension
- 1102 Spring Creek Cir
- 1712 N 2nd Street Extension
- 1731 N 2nd Street Extension
- 1712 N 2nd St
- 1682 N 2nd Street Extension
- 1104 Spring Creek Cir
- 1739 N 2nd Street Extension
- 1101 Spring Creek Cir
- 1659 N 2nd Street Extension
- 1106 Spring Creek Cir
- 1749 N 2nd St
- 1664 N 2nd Street Extension
- 1749 N 2nd Street Extension
- 1664 N 2nd St
- 1103 Spring Creek Cir
- 1794 N 2nd Street Extension
- 1156 Spring Creek Cir
- 1759 N 2nd St
- 1108 Spring Creek Cir