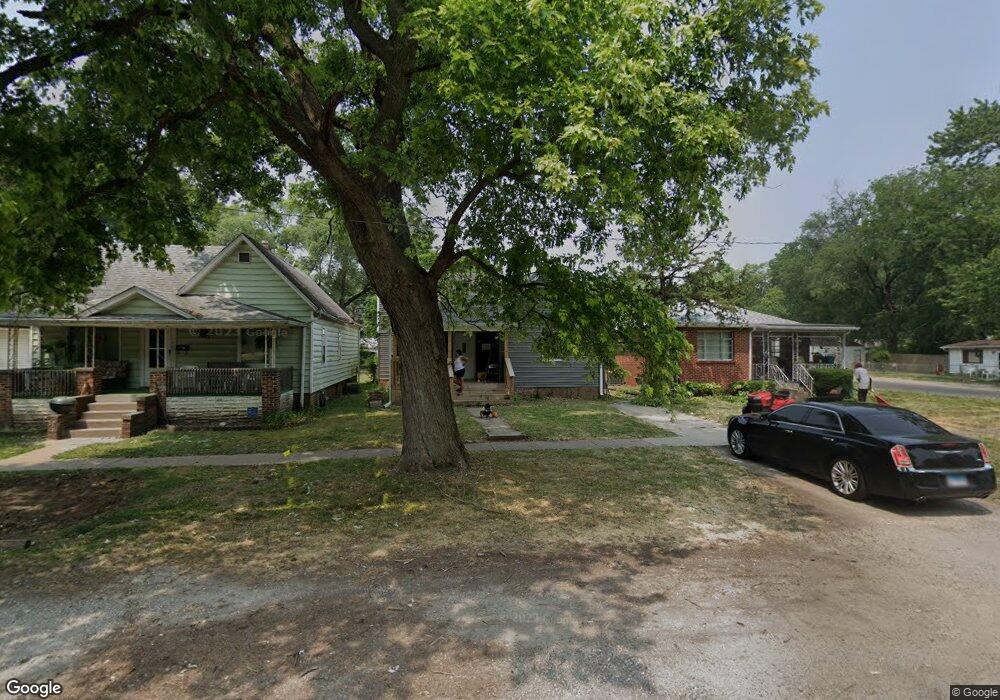
1703 S 14th St Springfield, IL 62703
Estimated Value: $71,000 - $89,000
3
Beds
2
Baths
1,019
Sq Ft
$77/Sq Ft
Est. Value
About This Home
This home is located at 1703 S 14th St, Springfield, IL 62703 and is currently estimated at $78,347, approximately $76 per square foot. 1703 S 14th St is a home located in Sangamon County with nearby schools including Owen Marsh Elementary School, Benjamin Franklin Middle School, and Springfield Southeast High School.
Ownership History
Date
Name
Owned For
Owner Type
Purchase Details
Closed on
Aug 15, 2023
Sold by
Tdl Properties One Llc
Bought by
Davis Joseph
Current Estimated Value
Purchase Details
Closed on
Jul 10, 2023
Sold by
Ruffin Christine
Bought by
Tdl Properties One Llc
Purchase Details
Closed on
Jul 9, 2023
Sold by
Ruffin Christine
Bought by
Tdl Properties One Llc
Purchase Details
Closed on
Jun 6, 2023
Sold by
Quevedo Roberto Vargas
Bought by
Ruffin Christine
Purchase Details
Closed on
Jun 5, 2023
Sold by
Quevedo Roberto Vargas
Bought by
Ruffin Christine
Purchase Details
Closed on
Jun 2, 2023
Sold by
Rufus James
Bought by
Quevedo Roberto Vargas
Purchase Details
Closed on
Dec 28, 2022
Sold by
Rufus James
Bought by
Rufus James and Quevado Roberto Vargas
Purchase Details
Closed on
Jan 19, 2021
Sold by
Willis Jr Norman L
Bought by
Rufus James
Create a Home Valuation Report for This Property
The Home Valuation Report is an in-depth analysis detailing your home's value as well as a comparison with similar homes in the area
Home Values in the Area
Average Home Value in this Area
Purchase History
| Date | Buyer | Sale Price | Title Company |
|---|---|---|---|
| Davis Joseph | -- | None Listed On Document | |
| Tdl Properties One Llc | -- | None Listed On Document | |
| Tdl Properties One Llc | -- | None Listed On Document | |
| Ruffin Christine | -- | None Listed On Document | |
| Ruffin Christine | -- | None Listed On Document | |
| Quevedo Roberto Vargas | -- | None Listed On Document | |
| Rufus James | -- | -- | |
| Rufus James | $8,000 | -- |
Source: Public Records
Tax History Compared to Growth
Tax History
| Year | Tax Paid | Tax Assessment Tax Assessment Total Assessment is a certain percentage of the fair market value that is determined by local assessors to be the total taxable value of land and additions on the property. | Land | Improvement |
|---|---|---|---|---|
| 2024 | $1,539 | $18,321 | $1,490 | $16,831 |
| 2023 | $1,480 | $16,735 | $1,361 | $15,374 |
| 2022 | $1,423 | $15,875 | $1,291 | $14,584 |
| 2021 | $882 | $9,800 | $1,242 | $8,558 |
| 2020 | $865 | $9,815 | $1,244 | $8,571 |
| 2019 | $849 | $9,781 | $1,240 | $8,541 |
| 2018 | $917 | $10,849 | $1,234 | $9,615 |
| 2017 | $898 | $10,709 | $1,218 | $9,491 |
| 2016 | $880 | $10,553 | $1,200 | $9,353 |
| 2015 | $872 | $10,427 | $1,186 | $9,241 |
| 2014 | $858 | $10,359 | $1,178 | $9,181 |
| 2013 | $1,334 | $16,470 | $1,178 | $15,292 |
Source: Public Records
Map
Nearby Homes
- 2023 E Spruce St
- 2041 E Cedar St
- 1604 S 15th St
- 1833 S Street Ct
- 1903 S 16th St
- 1322 S Grand Ave E
- 1842 S Martin Luther King jr Dr
- 2120 S 13th St
- 2114 S Renfro St
- 1920 S 19th St
- 2154 S 13th St
- 1430 S 8th St
- 725 E Spruce St
- 2216 S 13th St
- 1616 S 7th St
- 2228 S 14th St
- 800 Clay St
- 1118 S Martin Luther King Junior Dr
- 2313 S 13th St
- 1715 E Clay St
- 1701 S 14th St
- 1707 S 14th St
- 1709 S 14th St
- 1721 S 14th St
- 1629 S 14th St
- 1306 E Spruce St
- 1700 S 14th St
- 1704 S 14th St
- 1729 S 14th St
- 1304 E Spruce St
- 1702 S 14th St
- 1313 E Spruce St
- 1708 S 14th St
- 1611 S 14th St
- 1628 S 14th St
- 1307 E Laurel St
- 1300 E Spruce St
- 1305 E Spruce St
- 1609 S 14th St
- 1609 S 14th St