Estimated Value: $82,000 - $167,808
2
Beds
1
Bath
1,456
Sq Ft
$88/Sq Ft
Est. Value
About This Home
This home is located at 1703 S 3rd St, Merom, IN 47861 and is currently estimated at $127,452, approximately $87 per square foot. 1703 S 3rd St is a home with nearby schools including Sullivan High School and Rural Community Academy.
Ownership History
Date
Name
Owned For
Owner Type
Purchase Details
Closed on
Aug 16, 2021
Sold by
Bennett Wendy V and Bennette Billy J
Bought by
Cox Tracey June
Current Estimated Value
Purchase Details
Closed on
Nov 9, 2017
Sold by
Johnson Harold W and Johnson Loretta M
Bought by
Mccammon Mark
Purchase Details
Closed on
Oct 15, 2015
Sold by
Creed Brenda K and Creed Roger O
Bought by
Conover Patricia A
Purchase Details
Closed on
Feb 20, 2014
Sold by
Kinnett Bryan L
Bought by
Jpmorgan Chase Bank National Association
Purchase Details
Closed on
Sep 10, 2013
Sold by
Hampton Brian L and Hampton Jessica L
Bought by
Hampton Jessica L
Purchase Details
Closed on
Sep 30, 2010
Sold by
Cunningham James F and Cunningham Diana C
Bought by
Cunningham Diana C
Create a Home Valuation Report for This Property
The Home Valuation Report is an in-depth analysis detailing your home's value as well as a comparison with similar homes in the area
Home Values in the Area
Average Home Value in this Area
Purchase History
| Date | Buyer | Sale Price | Title Company |
|---|---|---|---|
| Cox Tracey June | -- | None Available | |
| Mccammon Mark | -- | None Available | |
| Conover Patricia A | -- | Attorney | |
| Jpmorgan Chase Bank National Association | $61,200 | Attorney | |
| Hampton Jessica L | -- | None Available | |
| Cunningham Diana C | -- | -- |
Source: Public Records
Mortgage History
| Date | Status | Borrower | Loan Amount |
|---|---|---|---|
| Closed | Jpmorgan Chase Bank National Association | $0 |
Source: Public Records
Tax History Compared to Growth
Tax History
| Year | Tax Paid | Tax Assessment Tax Assessment Total Assessment is a certain percentage of the fair market value that is determined by local assessors to be the total taxable value of land and additions on the property. | Land | Improvement |
|---|---|---|---|---|
| 2024 | $451 | $56,900 | $10,200 | $46,700 |
| 2023 | $451 | $51,700 | $4,000 | $47,700 |
| 2022 | $120 | $4,000 | $4,000 | $0 |
| 2021 | $120 | $4,000 | $4,000 | $0 |
| 2020 | $120 | $4,000 | $4,000 | $0 |
| 2019 | $120 | $4,000 | $4,000 | $0 |
| 2018 | $120 | $4,000 | $4,000 | $0 |
| 2017 | $120 | $4,000 | $4,000 | $0 |
| 2016 | $117 | $4,000 | $4,000 | $0 |
| 2014 | $80 | $4,000 | $4,000 | $0 |
| 2013 | $80 | $4,000 | $4,000 | $0 |
Source: Public Records
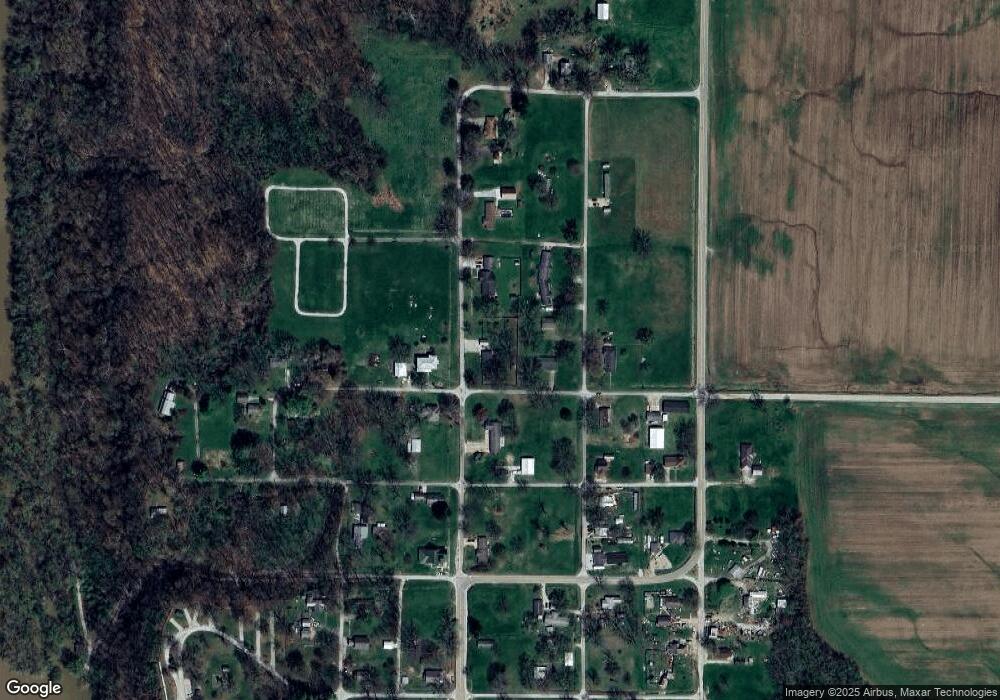
Map
Nearby Homes
- 1799 S 4th St
- 8566 Fourth St
- 2048 S 3rd St
- 2197 S 5th St
- 8626 W Phillip St
- 6295 W Co Road 375 S
- 14298 N 1650th St
- 507 E Market St
- 000 E Fort Dr
- 306 W Fort Dr
- 104 S Jackson St
- 104 S Main St
- 209 S Jackson St
- 308 S Lincoln St
- 107 E Lamotte St
- 0 Jackson St
- 421 S Pike St
- 600 S Pleasant St
- 301 S Pleasant St
- 0 County Road 300 N
- 8588 W Coleman St
- 1758 S 3rd St
- 1827 S 3rd St
- 1782 S 3rd St
- 1753 S 4th St
- 1828 S 3rd St
- 1701 S 3rd St
- 1862 S 3rd St
- 8561 W Cherry St
- 1808 S 5th St
- 8732 W Coleman St
- 1881 S 3rd St
- 1641 S 3rd St
- 8731 W Coleman St
- 8528 W Cherry St
- 8528 W Cherry St
- 8699 W Cherry St
- 1869 S 4th St
- 8570 Poplar St
- 1868 S 5th St