1703 SW 6th Ave Unit 32 Cape Coral, FL 33991
Hancock NeighborhoodEstimated Value: $624,000 - $672,000
3
Beds
2
Baths
3,299
Sq Ft
$198/Sq Ft
Est. Value
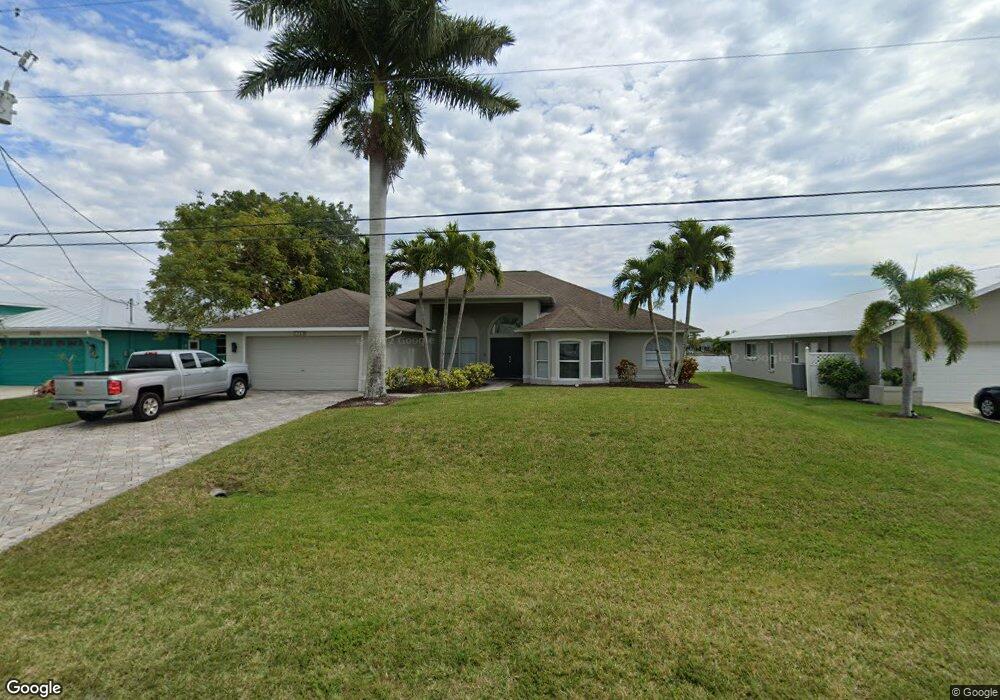
About This Home
This home is located at 1703 SW 6th Ave Unit 32, Cape Coral, FL 33991 and is currently estimated at $654,679, approximately $198 per square foot. 1703 SW 6th Ave Unit 32 is a home located in Lee County with nearby schools including Caloosa Elementary School, Cape Elementary School, and Tropic Isles Elementary School.
Ownership History
Date
Name
Owned For
Owner Type
Purchase Details
Closed on
May 25, 2023
Sold by
Gadlin Sandra L and Gadlin Steven Vanoy
Bought by
Roberts Sandra Lee
Current Estimated Value
Purchase Details
Closed on
Aug 8, 2022
Sold by
Ann Linares and Ann Collen
Bought by
Gadlin Sandra L and Gadlin Steven Vanoy
Home Financials for this Owner
Home Financials are based on the most recent Mortgage that was taken out on this home.
Original Mortgage
$608,400
Interest Rate
5.81%
Mortgage Type
VA
Purchase Details
Closed on
Aug 27, 2001
Sold by
Norris Rosemary
Bought by
Linares Carlos and Linares Colleen
Home Financials for this Owner
Home Financials are based on the most recent Mortgage that was taken out on this home.
Original Mortgage
$26,100
Interest Rate
7.08%
Create a Home Valuation Report for This Property
The Home Valuation Report is an in-depth analysis detailing your home's value as well as a comparison with similar homes in the area
Home Values in the Area
Average Home Value in this Area
Purchase History
| Date | Buyer | Sale Price | Title Company |
|---|---|---|---|
| Roberts Sandra Lee | $100 | None Listed On Document | |
| Gadlin Sandra L | $700,000 | All American Title Services | |
| Linares Carlos | $29,000 | -- |
Source: Public Records
Mortgage History
| Date | Status | Borrower | Loan Amount |
|---|---|---|---|
| Previous Owner | Gadlin Sandra L | $608,400 | |
| Previous Owner | Linares Carlos | $26,100 |
Source: Public Records
Tax History Compared to Growth
Tax History
| Year | Tax Paid | Tax Assessment Tax Assessment Total Assessment is a certain percentage of the fair market value that is determined by local assessors to be the total taxable value of land and additions on the property. | Land | Improvement |
|---|---|---|---|---|
| 2025 | $7,948 | $450,988 | $116,280 | $303,550 |
| 2024 | $7,948 | $449,006 | $120,407 | $294,338 |
| 2023 | $8,204 | $503,608 | $0 | $0 |
| 2022 | $3,010 | $184,962 | $0 | $0 |
| 2021 | $3,047 | $336,766 | $48,513 | $288,253 |
| 2020 | $3,078 | $177,096 | $0 | $0 |
| 2019 | $2,985 | $173,114 | $0 | $0 |
| 2018 | $2,971 | $169,886 | $0 | $0 |
| 2017 | $2,945 | $166,392 | $0 | $0 |
| 2016 | $2,874 | $275,645 | $48,327 | $227,318 |
| 2015 | $2,888 | $252,799 | $38,187 | $214,612 |
| 2014 | -- | $257,406 | $33,504 | $223,902 |
| 2013 | -- | $277,605 | $31,603 | $246,002 |
Source: Public Records
Map
Nearby Homes
- 1711 SW 6th Ave
- 520 SW Trafalgar Pkwy
- 1741 Emerald Cove Cir
- 618 SW 18th St
- 601 SW 15th Terrace
- 1624 SW 4th St
- 1512 SW 4th Ct
- 1808 Skyline Blvd
- 446 SW 19th Terrace
- 1514 SW 4th Place
- 910 Skyline Blvd
- 1307+1311 Skyline Blvd
- 1102 Skyline Blvd
- 1423 Skyline Blvd
- 1910 SW 7th Place
- 1511 SW 4th Place
- 110 SW 19th St
- 1511 Skyline Blvd
- 411 SW 19th Terrace
- 821 SW 17th St
- 1703 SW 6th Ave
- 1631 SW 6th Ave
- 1710 SW 6th Ave
- 1627 SW 6th Ave
- 1702 SW 6th Ave
- 1706 SW 6th Ave
- 1630 SW 6th Ave
- 1626 SW 6th Ave
- 1715 SW 6th Ave
- 1623 SW 6th Ave
- 1714 SW 6th Ave
- 1622 SW 6th Ave
- 1703 SW 6th Place Unit 62
- 1631 SW 6th Place
- 1709 SW 6th Place
- 1721 SW 6th Ave
- 1627 SW 6th Place
- 1617 SW 6th Ave
- 1617 SW 6th Ave
- 1718 SW 6th Ave