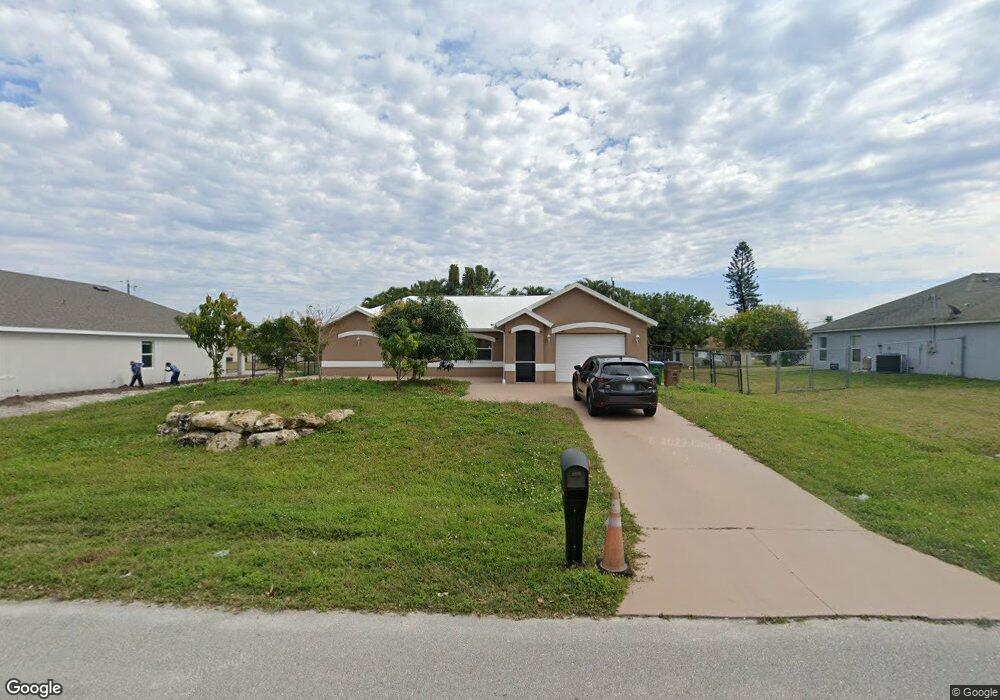
1703 SW 6th Place Unit 62 Cape Coral, FL 33991
Hancock NeighborhoodEstimated Value: $291,733 - $313,000
3
Beds
2
Baths
1,217
Sq Ft
$249/Sq Ft
Est. Value
About This Home
This home is located at 1703 SW 6th Place Unit 62, Cape Coral, FL 33991 and is currently estimated at $302,933, approximately $248 per square foot. 1703 SW 6th Place Unit 62 is a home located in Lee County with nearby schools including Caloosa Elementary School, Cape Elementary School, and Tropic Isles Elementary School.
Ownership History
Date
Name
Owned For
Owner Type
Purchase Details
Closed on
Sep 15, 2011
Sold by
Meyer Ulrich Andres and Engel Daniel
Bought by
Lanning Dulce M and Garcia Alfredo E Brandariz
Current Estimated Value
Purchase Details
Closed on
Feb 16, 2009
Sold by
Allen George
Bought by
Meyer Ulrich Andreas and Engel Daniel
Purchase Details
Closed on
Mar 7, 2002
Sold by
Deguzman Erynold and Deguzman Annie Jane
Bought by
Allen George
Home Financials for this Owner
Home Financials are based on the most recent Mortgage that was taken out on this home.
Original Mortgage
$114,615
Interest Rate
6.86%
Mortgage Type
FHA
Purchase Details
Closed on
Jun 15, 2001
Sold by
Martin Angelina and Martin Bernard
Bought by
Deguzman Reynold and Deguzman Annie Jane
Home Financials for this Owner
Home Financials are based on the most recent Mortgage that was taken out on this home.
Original Mortgage
$99,931
Interest Rate
7.09%
Mortgage Type
FHA
Create a Home Valuation Report for This Property
The Home Valuation Report is an in-depth analysis detailing your home's value as well as a comparison with similar homes in the area
Home Values in the Area
Average Home Value in this Area
Purchase History
| Date | Buyer | Sale Price | Title Company |
|---|---|---|---|
| Lanning Dulce M | $57,000 | Attorney | |
| Meyer Ulrich Andreas | $64,000 | Title Specialists Of The Gul | |
| Allen George | $116,500 | -- | |
| Deguzman Reynold | $3,800 | -- |
Source: Public Records
Mortgage History
| Date | Status | Borrower | Loan Amount |
|---|---|---|---|
| Previous Owner | Allen George | $114,615 | |
| Previous Owner | Deguzman Reynold | $99,931 |
Source: Public Records
Tax History Compared to Growth
Tax History
| Year | Tax Paid | Tax Assessment Tax Assessment Total Assessment is a certain percentage of the fair market value that is determined by local assessors to be the total taxable value of land and additions on the property. | Land | Improvement |
|---|---|---|---|---|
| 2025 | $2,133 | $52,547 | -- | -- |
| 2024 | $2,057 | $51,066 | -- | -- |
| 2023 | $2,057 | $44,579 | $0 | $0 |
| 2022 | $1,978 | $48,135 | $0 | $0 |
| 2021 | $1,911 | $161,161 | $30,834 | $130,327 |
| 2020 | $1,835 | $46,088 | $0 | $0 |
| 2019 | $1,806 | $45,052 | $0 | $0 |
| 2018 | $1,785 | $44,212 | $0 | $0 |
| 2017 | $1,757 | $43,303 | $0 | $0 |
| 2016 | $1,784 | $112,118 | $14,023 | $98,095 |
| 2015 | $1,754 | $99,512 | $11,370 | $88,142 |
| 2014 | $1,681 | $91,397 | $8,396 | $83,001 |
| 2013 | -- | $77,499 | $6,512 | $70,987 |
Source: Public Records
Map
Nearby Homes
- 1711 SW 6th Ave
- 618 SW 18th St
- 520 SW Trafalgar Pkwy
- 1741 Emerald Cove Cir
- 601 SW 15th Terrace
- 1808 Skyline Blvd
- 910 Skyline Blvd
- 1307+1311 Skyline Blvd
- 1102 Skyline Blvd
- 1423 Skyline Blvd
- 110 SW 19th St
- 821 SW 17th St
- 1910 SW 7th Place
- 831 SW 17th Terrace
- 1511 Skyline Blvd
- 1512 SW 4th Ct
- 1624 SW 4th St
- 446 SW 19th Terrace
- 815 SW Trafalgar Pkwy
- 1514 SW 4th Place
- 1631 SW 6th Place
- 1709 SW 6th Place
- 1702 SW 6th Ave
- 1706 SW 6th Ave
- 1630 SW 6th Ave
- 1627 SW 6th Place
- 1626 SW 6th Ave
- 1715 SW 6th Place
- 1710 SW 6th Ave
- 1623 SW 6th Place
- 1622 SW 6th Ave
- 1714 SW 6th Ave
- 1703 SW 6th Ave Unit 32
- 1703 SW 6th Ave
- 1631 SW 6th Ave
- 1719 SW 6th Place
- 1619 SW 6th Place
- 1718 SW 6th Ave
- 1618 SW 6th Ave
- 1627 SW 6th Ave