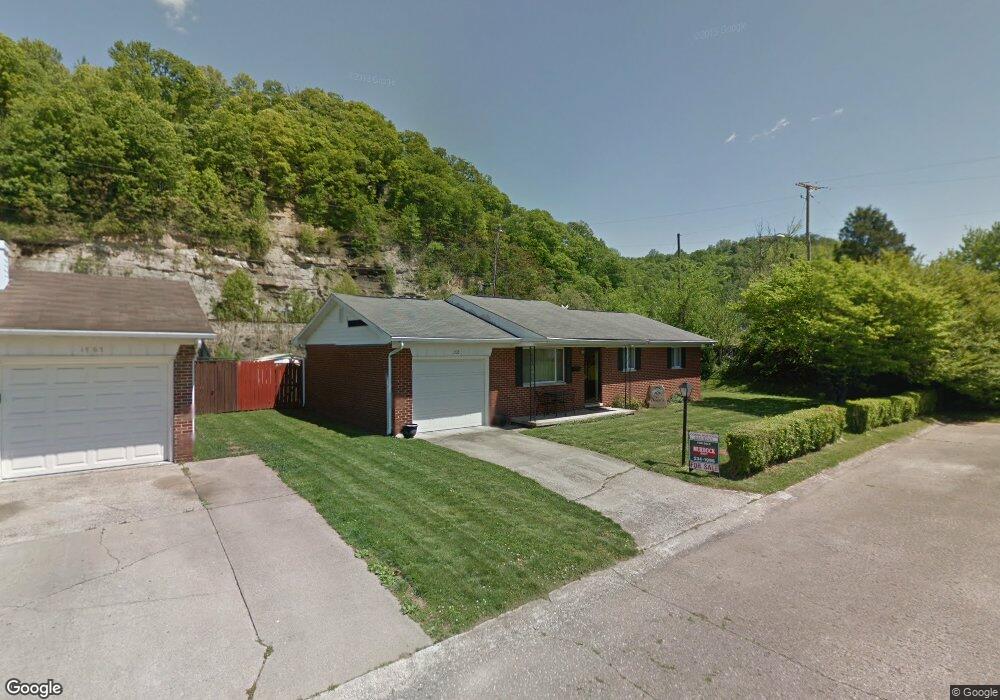
1703 Waldo Dr Unit GO-3 Ironton, OH 45638
Estimated Value: $135,611 - $154,000
3
Beds
2
Baths
1,257
Sq Ft
$116/Sq Ft
Est. Value
About This Home
This home is located at 1703 Waldo Dr Unit GO-3, Ironton, OH 45638 and is currently estimated at $145,903, approximately $116 per square foot. 1703 Waldo Dr Unit GO-3 is a home located in Lawrence County with nearby schools including Ironton Elementary School, Ironton Middle School, and Ironton High School.
Ownership History
Date
Name
Owned For
Owner Type
Purchase Details
Closed on
Apr 20, 2023
Sold by
Dean Jimmy R
Bought by
Johnson Sandra Michelle and Johnson Jabin
Current Estimated Value
Home Financials for this Owner
Home Financials are based on the most recent Mortgage that was taken out on this home.
Original Mortgage
$85,424
Outstanding Balance
$82,971
Interest Rate
6.42%
Mortgage Type
FHA
Estimated Equity
$62,932
Purchase Details
Closed on
Nov 1, 1989
Sold by
Schramm Nicholas and Schramm Loret
Bought by
Dean Jimmy R and Dean Kathleen
Create a Home Valuation Report for This Property
The Home Valuation Report is an in-depth analysis detailing your home's value as well as a comparison with similar homes in the area
Home Values in the Area
Average Home Value in this Area
Purchase History
| Date | Buyer | Sale Price | Title Company |
|---|---|---|---|
| Johnson Sandra Michelle | $92,000 | None Listed On Document | |
| Dean Jimmy R | $36,000 | -- |
Source: Public Records
Mortgage History
| Date | Status | Borrower | Loan Amount |
|---|---|---|---|
| Open | Johnson Sandra Michelle | $85,424 |
Source: Public Records
Tax History Compared to Growth
Tax History
| Year | Tax Paid | Tax Assessment Tax Assessment Total Assessment is a certain percentage of the fair market value that is determined by local assessors to be the total taxable value of land and additions on the property. | Land | Improvement |
|---|---|---|---|---|
| 2024 | -- | $32,670 | $4,650 | $28,020 |
| 2023 | $1,209 | $32,670 | $4,650 | $28,020 |
| 2022 | $866 | $32,670 | $4,650 | $28,020 |
| 2021 | $695 | $27,250 | $3,040 | $24,210 |
| 2020 | $711 | $27,250 | $3,040 | $24,210 |
| 2019 | $708 | $27,250 | $3,040 | $24,210 |
| 2018 | $716 | $27,250 | $3,040 | $24,210 |
| 2017 | $715 | $27,250 | $3,040 | $24,210 |
| 2016 | $669 | $27,250 | $3,040 | $24,210 |
| 2015 | $548 | $23,310 | $3,040 | $20,270 |
| 2014 | $529 | $23,310 | $3,040 | $20,270 |
| 2013 | $528 | $23,310 | $3,040 | $20,270 |
Source: Public Records
Map
Nearby Homes