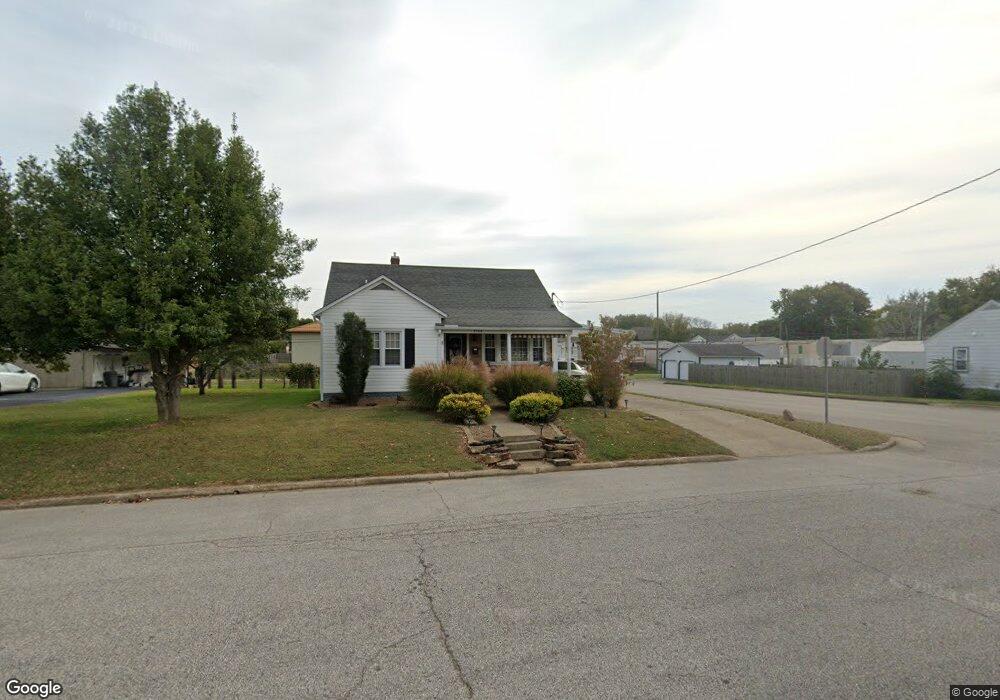
1704 12th St Tell City, IN 47586
Estimated Value: $112,000 - $156,000
2
Beds
1
Bath
1,001
Sq Ft
$135/Sq Ft
Est. Value
About This Home
This home is located at 1704 12th St, Tell City, IN 47586 and is currently estimated at $135,435, approximately $135 per square foot. 1704 12th St is a home located in Perry County with nearby schools including William Tell Elementary School, Tell City Junior/Senior High School, and Agape Christian Academy.
Ownership History
Date
Name
Owned For
Owner Type
Purchase Details
Closed on
Sep 1, 2016
Sold by
Bolin Laira A
Bought by
Nance Mark A and Nance Donna D
Current Estimated Value
Purchase Details
Closed on
Feb 25, 2009
Sold by
Deom Darla J and Deom Kenneth J
Bought by
Bolin Timothy E and Bolin Laira A
Home Financials for this Owner
Home Financials are based on the most recent Mortgage that was taken out on this home.
Original Mortgage
$72,930
Interest Rate
4.91%
Mortgage Type
FHA
Create a Home Valuation Report for This Property
The Home Valuation Report is an in-depth analysis detailing your home's value as well as a comparison with similar homes in the area
Home Values in the Area
Average Home Value in this Area
Purchase History
| Date | Buyer | Sale Price | Title Company |
|---|---|---|---|
| Nance Mark A | $110,000 | -- | |
| Bolin Timothy E | -- | None Available |
Source: Public Records
Mortgage History
| Date | Status | Borrower | Loan Amount |
|---|---|---|---|
| Previous Owner | Bolin Timothy E | $72,930 |
Source: Public Records
Tax History Compared to Growth
Tax History
| Year | Tax Paid | Tax Assessment Tax Assessment Total Assessment is a certain percentage of the fair market value that is determined by local assessors to be the total taxable value of land and additions on the property. | Land | Improvement |
|---|---|---|---|---|
| 2024 | $1,484 | $148,400 | $10,900 | $137,500 |
| 2023 | $1,397 | $139,700 | $10,900 | $128,800 |
| 2022 | $1,371 | $138,200 | $10,900 | $127,300 |
| 2021 | $1,307 | $131,700 | $7,500 | $124,200 |
| 2020 | $1,178 | $118,800 | $7,500 | $111,300 |
| 2019 | $1,096 | $109,600 | $7,200 | $102,400 |
| 2018 | $1,067 | $106,700 | $7,100 | $99,600 |
| 2017 | $1,037 | $103,700 | $7,100 | $96,600 |
| 2016 | $587 | $76,600 | $7,100 | $69,500 |
| 2014 | $628 | $76,700 | $7,100 | $69,600 |
| 2013 | $628 | $75,600 | $7,100 | $68,500 |
Source: Public Records
Map
Nearby Homes