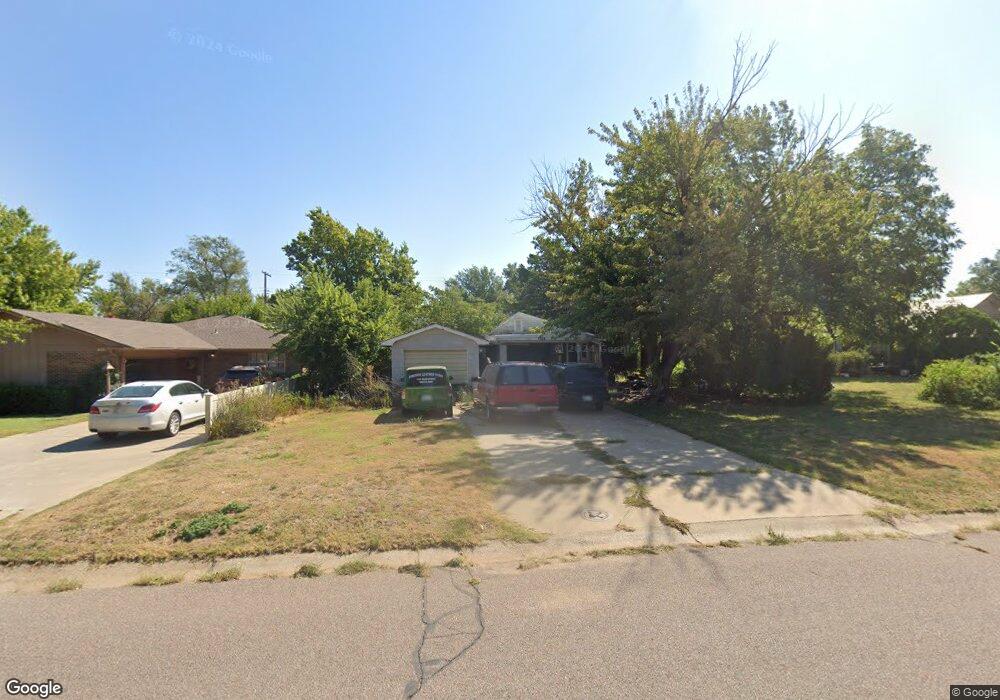
1704 19th St Woodward, OK 73801
Estimated Value: $57,000 - $116,000
2
Beds
1
Bath
1,434
Sq Ft
$61/Sq Ft
Est. Value
About This Home
This home is located at 1704 19th St, Woodward, OK 73801 and is currently estimated at $87,346, approximately $60 per square foot. 1704 19th St is a home located in Woodward County with nearby schools including Woodward High School and Woodward Christian Academy.
Ownership History
Date
Name
Owned For
Owner Type
Purchase Details
Closed on
May 7, 2024
Sold by
Robinson Robert A and Robinson Kelle R
Bought by
Robinson Brett and Robinson Mikel
Current Estimated Value
Purchase Details
Closed on
Jul 16, 2018
Sold by
Robinson Dorothy M and Robinson Robert A
Bought by
Robinson Brett A and Robinson Mikel M
Home Financials for this Owner
Home Financials are based on the most recent Mortgage that was taken out on this home.
Original Mortgage
$28,850
Interest Rate
4.5%
Mortgage Type
Future Advance Clause Open End Mortgage
Create a Home Valuation Report for This Property
The Home Valuation Report is an in-depth analysis detailing your home's value as well as a comparison with similar homes in the area
Home Values in the Area
Average Home Value in this Area
Purchase History
| Date | Buyer | Sale Price | Title Company |
|---|---|---|---|
| Robinson Brett | -- | None Listed On Document | |
| Robinson Brett | -- | None Listed On Document | |
| Robinson Brett A | $36,500 | Woodward County Abstract Co |
Source: Public Records
Mortgage History
| Date | Status | Borrower | Loan Amount |
|---|---|---|---|
| Previous Owner | Robinson Brett A | $28,850 |
Source: Public Records
Tax History Compared to Growth
Tax History
| Year | Tax Paid | Tax Assessment Tax Assessment Total Assessment is a certain percentage of the fair market value that is determined by local assessors to be the total taxable value of land and additions on the property. | Land | Improvement |
|---|---|---|---|---|
| 2024 | $342 | $3,753 | $1,310 | $2,443 |
| 2023 | $326 | $3,574 | $1,310 | $2,264 |
| 2022 | $316 | $3,404 | $1,310 | $2,094 |
| 2021 | $381 | $4,215 | $535 | $3,680 |
| 2020 | $366 | $4,014 | $505 | $3,509 |
| 2019 | $341 | $3,823 | $477 | $3,346 |
| 2018 | $149 | $3,641 | $935 | $2,706 |
| 2017 | $147 | $3,641 | $935 | $2,706 |
| 2016 | $149 | $3,641 | $935 | $2,706 |
| 2015 | $186 | $4,128 | $935 | $3,193 |
| 2014 | $143 | $3,641 | $935 | $2,706 |
Source: Public Records
Map
Nearby Homes