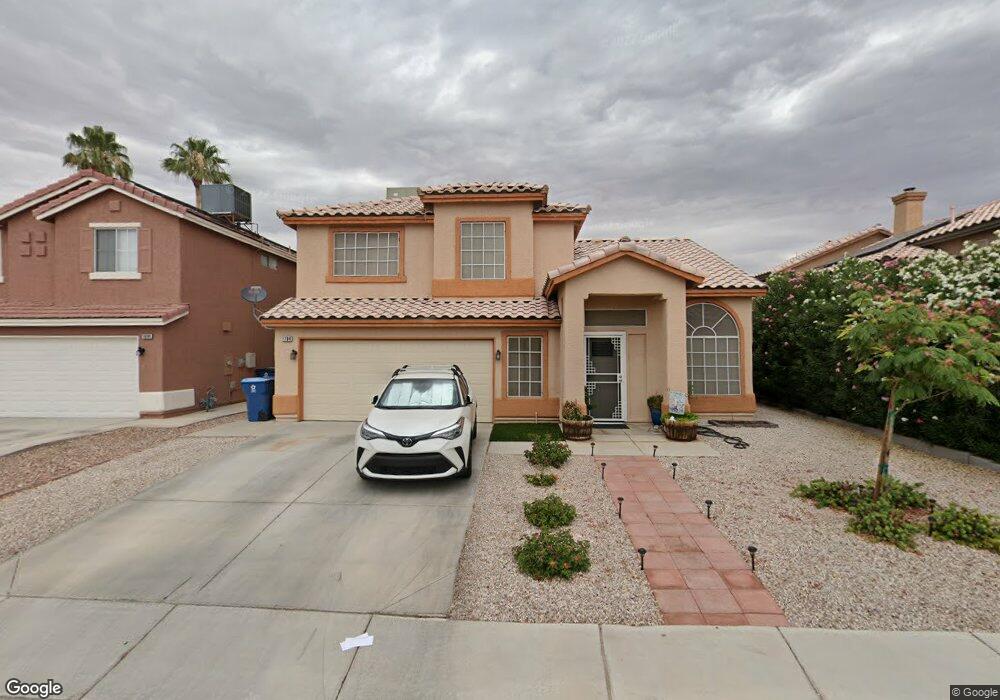
1704 Apricot Tree Cir Las Vegas, NV 89142
Estimated Value: $404,202 - $473,000
4
Beds
3
Baths
2,007
Sq Ft
$219/Sq Ft
Est. Value
About This Home
This home is located at 1704 Apricot Tree Cir, Las Vegas, NV 89142 and is currently estimated at $439,301, approximately $218 per square foot. 1704 Apricot Tree Cir is a home located in Clark County with nearby schools including Dan Goldfarb Elementary School, Kathleen & Tim Harney Middle School, and Las Vegas High School.
Ownership History
Date
Name
Owned For
Owner Type
Purchase Details
Closed on
Dec 24, 2007
Sold by
Carrasco Jose L and Sandoval Rosa M
Bought by
Carter Jenny A
Current Estimated Value
Home Financials for this Owner
Home Financials are based on the most recent Mortgage that was taken out on this home.
Original Mortgage
$173,600
Outstanding Balance
$140,372
Interest Rate
5.96%
Mortgage Type
Unknown
Estimated Equity
$298,929
Purchase Details
Closed on
Jun 13, 2007
Sold by
Carrasco Jose L
Bought by
Carrasco Jose L and Sandoval Rosa M
Purchase Details
Closed on
Jun 8, 2005
Sold by
Gerzel Kenneth R
Bought by
Carrasco Jose L
Home Financials for this Owner
Home Financials are based on the most recent Mortgage that was taken out on this home.
Original Mortgage
$286,110
Interest Rate
7.25%
Mortgage Type
Unknown
Purchase Details
Closed on
Aug 5, 1993
Sold by
Lewis Properties
Bought by
Gerzel Kenneth R
Create a Home Valuation Report for This Property
The Home Valuation Report is an in-depth analysis detailing your home's value as well as a comparison with similar homes in the area
Home Values in the Area
Average Home Value in this Area
Purchase History
| Date | Buyer | Sale Price | Title Company |
|---|---|---|---|
| Carter Jenny A | $217,000 | Noble Title | |
| Carrasco Jose L | -- | None Available | |
| Carrasco Jose L | $317,900 | First Amer Title Co Of Nv | |
| Gerzel Kenneth R | $124,000 | Stewart Title |
Source: Public Records
Mortgage History
| Date | Status | Borrower | Loan Amount |
|---|---|---|---|
| Open | Carter Jenny A | $173,600 | |
| Previous Owner | Carrasco Jose L | $286,110 |
Source: Public Records
Tax History Compared to Growth
Tax History
| Year | Tax Paid | Tax Assessment Tax Assessment Total Assessment is a certain percentage of the fair market value that is determined by local assessors to be the total taxable value of land and additions on the property. | Land | Improvement |
|---|---|---|---|---|
| 2025 | $1,261 | $83,216 | $24,850 | $58,366 |
| 2024 | $1,225 | $83,216 | $24,850 | $58,366 |
| 2023 | $1,225 | $84,533 | $28,700 | $55,833 |
| 2022 | $1,469 | $74,707 | $23,450 | $51,257 |
| 2021 | $1,155 | $70,361 | $21,350 | $49,011 |
| 2020 | $1,118 | $69,443 | $20,650 | $48,793 |
| 2019 | $1,104 | $65,927 | $17,850 | $48,077 |
| 2018 | $1,054 | $60,953 | $14,700 | $46,253 |
| 2017 | $1,769 | $60,319 | $13,300 | $47,019 |
| 2016 | $1,240 | $50,154 | $9,450 | $40,704 |
| 2015 | $1,237 | $41,302 | $8,050 | $33,252 |
| 2014 | $1,208 | $33,718 | $7,000 | $26,718 |
Source: Public Records
Map
Nearby Homes
- 6092 Golden Nectar Way
- 1779 Pineapple Tree Ct
- 6094 Bing Cherry Dr
- 6311 American Beauty Ave
- 6384 Cornstalk Cir
- 6276 Back Woods Rd
- 6058 Grape Blossom Ave
- 6053 Wild Berry Dr
- 1927 Raspberry Hill Rd
- 6233 Apple Orchard Dr
- 1346 Doucette Dr
- 6131 Pumpkin Patch Ave
- 1747 Angel Falls St
- 1291 Orange Meadow St
- 2179 Raspberry Hill Rd
- 1950 Turtlerock St
- 1259 Plum Canyon St
- 2234 Falling Rain Dr
- 6260 Peach Orchard Rd
- 2316 Tulip Field St
- 1712 Apricot Tree Cir
- 1694 Apricot Tree Cir
- 1655 Apple Cart Cir
- 1684 Apricot Tree Cir
- 1663 Apple Cart Cir
- 1720 Apricot Tree Cir
- 1645 Apple Cart Cir
- 1671 Apple Cart Cir
- 1637 Apple Cart Cir
- 1676 Apricot Tree Cir
- 1711 Apricot Tree Cir
- 1693 Apricot Tree Cir
- 1719 Apricot Tree Cir
- 1631 Apple Cart Cir
- 1683 Apricot Tree Cir
- 1668 Apricot Tree Cir
- 1675 Apricot Tree Cir
- 1627 Apple Cart Cir
- 1650 Apple Cart Cir