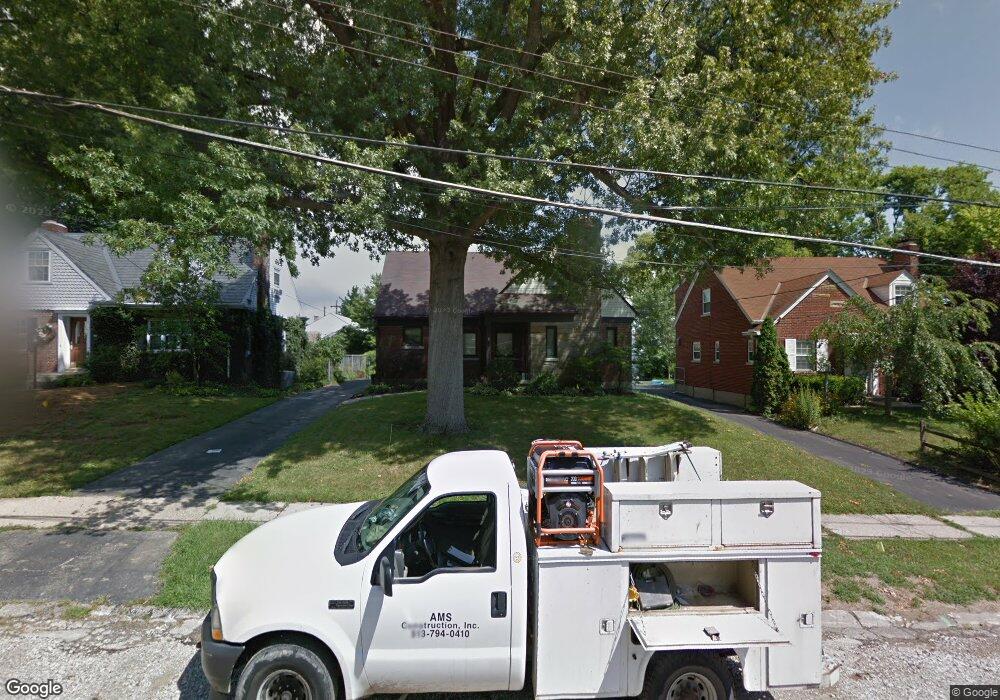
1704 Flora Ave Cincinnati, OH 45231
Estimated Value: $212,000 - $256,000
3
Beds
2
Baths
2,203
Sq Ft
$109/Sq Ft
Est. Value
About This Home
This home is located at 1704 Flora Ave, Cincinnati, OH 45231 and is currently estimated at $240,414, approximately $109 per square foot. 1704 Flora Ave is a home located in Hamilton County with nearby schools including North College Hill Elementary School, North College Hill Middle School, and North College Hill High School.
Ownership History
Date
Name
Owned For
Owner Type
Purchase Details
Closed on
May 29, 2008
Sold by
Schwartz Andrea K and Schwartz Martin
Bought by
Martin Harry
Current Estimated Value
Home Financials for this Owner
Home Financials are based on the most recent Mortgage that was taken out on this home.
Original Mortgage
$124,053
Outstanding Balance
$78,167
Interest Rate
6.04%
Mortgage Type
FHA
Estimated Equity
$162,247
Purchase Details
Closed on
Oct 15, 2002
Sold by
Hensley Gary C and Hensley Dora A
Bought by
Lemmink Andrea K
Home Financials for this Owner
Home Financials are based on the most recent Mortgage that was taken out on this home.
Original Mortgage
$96,000
Interest Rate
6.18%
Purchase Details
Closed on
Dec 31, 1997
Sold by
Stiens John W and Stiens Teresa A
Bought by
Hensley Gary C and Hensley Dora A
Create a Home Valuation Report for This Property
The Home Valuation Report is an in-depth analysis detailing your home's value as well as a comparison with similar homes in the area
Home Values in the Area
Average Home Value in this Area
Purchase History
| Date | Buyer | Sale Price | Title Company |
|---|---|---|---|
| Martin Harry | $126,000 | Ltoc | |
| Lemmink Andrea K | $120,000 | Vintage Title Agency Inc | |
| Hensley Gary C | $99,900 | -- |
Source: Public Records
Mortgage History
| Date | Status | Borrower | Loan Amount |
|---|---|---|---|
| Open | Martin Harry | $124,053 | |
| Previous Owner | Lemmink Andrea K | $96,000 |
Source: Public Records
Tax History
| Year | Tax Paid | Tax Assessment Tax Assessment Total Assessment is a certain percentage of the fair market value that is determined by local assessors to be the total taxable value of land and additions on the property. | Land | Improvement |
|---|---|---|---|---|
| 2025 | $3,218 | $61,887 | $8,127 | $53,760 |
| 2024 | $3,144 | $61,887 | $8,127 | $53,760 |
| 2023 | $3,167 | $61,887 | $8,127 | $53,760 |
| 2022 | $2,742 | $38,235 | $6,640 | $31,595 |
| 2021 | $2,689 | $38,235 | $6,640 | $31,595 |
| 2020 | $2,354 | $38,235 | $6,640 | $31,595 |
| 2019 | $2,306 | $33,537 | $5,824 | $27,713 |
| 2018 | $2,307 | $33,537 | $5,824 | $27,713 |
| 2017 | $2,179 | $33,537 | $5,824 | $27,713 |
| 2016 | $2,306 | $37,521 | $7,186 | $30,335 |
| 2015 | $2,308 | $37,521 | $7,186 | $30,335 |
| 2014 | $2,305 | $37,521 | $7,186 | $30,335 |
| 2013 | $2,378 | $39,914 | $7,644 | $32,270 |
Source: Public Records
Map
Nearby Homes
- 1626 Flora Ave
- 1625 Joseph Ct
- 1541 Southridge Ln
- 1650 Joseph Ct
- 6961 La Boiteaux Ave
- 1718 Joseph Ct
- 6839 Greismer Ave
- 1584 W Galbraith Rd
- 6916 Noble Ave
- 1814 Goodman Ave
- 1701 Goodman Ave
- 6822 Betts Ave
- 1805 de Armand Ave
- 1478 Foxwood Dr
- 1838 de Armand Ave
- 1476 Foxwood Dr
- 7310 Forest Ave
- 7274 Elizabeth St
- 1481 Saint Clair Ave
- 6942 Gloria Dr
- 1706 Flora Ave
- 1700 Flora Ave
- 1708 Flora Ave
- 1628 Flora Ave
- 1629 Marilyn Ln
- 1627 Marilyn Ln
- 1631 Marilyn Ln
- 1710 Flora Ave
- 1625 Marilyn Ln
- 1633 Marilyn Ln
- 1705 Flora Ave
- 1707 Flora Ave
- 1701 Flora Ave
- 1623 Marilyn Ln
- 1701 Marilyn Ln
- 1712 Flora Ave
- 1623 Flora Ave
- 1621 Marilyn Ln
- 1703 Marilyn Ln
- 1711 Flora Ave
Your Personal Tour Guide
Ask me questions while you tour the home.