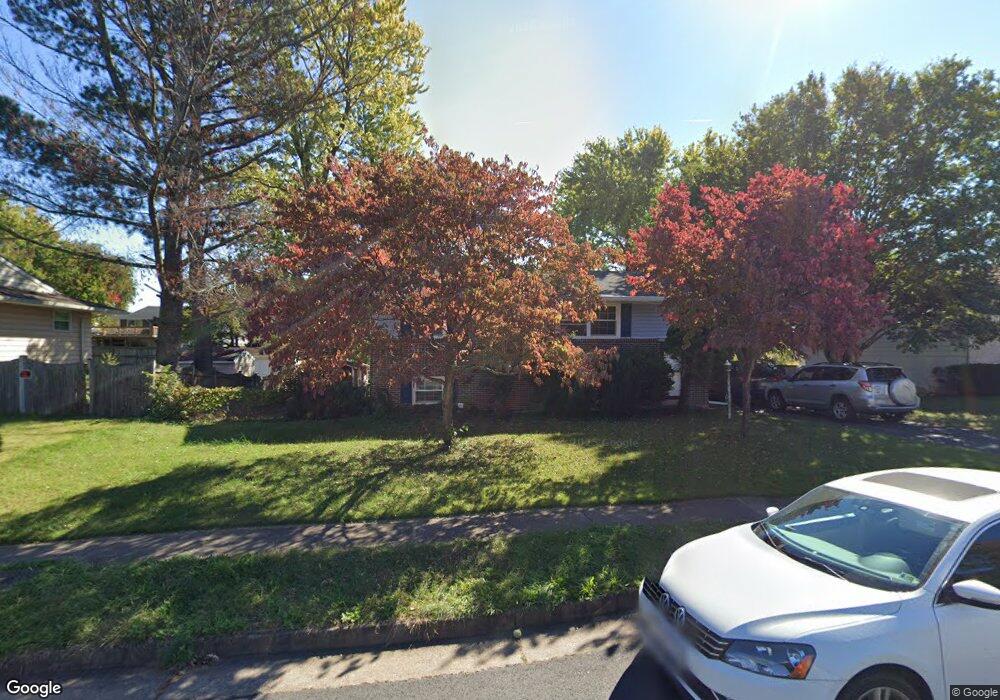
1704 N Amelia St Sterling, VA 20164
Estimated Value: $545,000 - $611,000
4
Beds
3
Baths
912
Sq Ft
$637/Sq Ft
Est. Value
About This Home
This home is located at 1704 N Amelia St, Sterling, VA 20164 and is currently estimated at $580,856, approximately $636 per square foot. 1704 N Amelia St is a home located in Loudoun County with nearby schools including Rolling Ridge Elementary School, Sterling Middle School, and Park View High School.
Ownership History
Date
Name
Owned For
Owner Type
Purchase Details
Closed on
Jul 8, 2019
Sold by
Khan Mohammad Abbas
Bought by
Khan Mohammad Abbas and Khan Mohammad G
Current Estimated Value
Purchase Details
Closed on
May 15, 2018
Sold by
Khan Mohammad Abbas and Khan Muhammad Altaf
Bought by
Khan Mohammad Abbas
Purchase Details
Closed on
Mar 10, 2018
Sold by
Khan Muhammad Altaf and Khan Mohammad Iiyas
Bought by
Khan Mohammad Abbas and Khan Muhammad Altaf
Purchase Details
Closed on
Jun 21, 2002
Sold by
Sharp Richard
Bought by
Khan Mohammed G and Khan,Mohammed I
Home Financials for this Owner
Home Financials are based on the most recent Mortgage that was taken out on this home.
Original Mortgage
$215,910
Outstanding Balance
$91,291
Interest Rate
6.81%
Mortgage Type
New Conventional
Estimated Equity
$489,565
Create a Home Valuation Report for This Property
The Home Valuation Report is an in-depth analysis detailing your home's value as well as a comparison with similar homes in the area
Home Values in the Area
Average Home Value in this Area
Purchase History
| Date | Buyer | Sale Price | Title Company |
|---|---|---|---|
| Khan Mohammad Abbas | -- | None Available | |
| Khan Mohammad Abbas | -- | None Available | |
| Khan Mohammad Abbas | -- | None Available | |
| Khan Mohammed G | $239,900 | -- |
Source: Public Records
Mortgage History
| Date | Status | Borrower | Loan Amount |
|---|---|---|---|
| Open | Khan Mohammed G | $215,910 |
Source: Public Records
Tax History Compared to Growth
Tax History
| Year | Tax Paid | Tax Assessment Tax Assessment Total Assessment is a certain percentage of the fair market value that is determined by local assessors to be the total taxable value of land and additions on the property. | Land | Improvement |
|---|---|---|---|---|
| 2025 | $4,524 | $561,970 | $234,400 | $327,570 |
| 2024 | $4,435 | $512,670 | $209,400 | $303,270 |
| 2023 | $4,214 | $481,560 | $209,400 | $272,160 |
| 2022 | $4,059 | $456,060 | $189,400 | $266,660 |
| 2021 | $4,040 | $412,230 | $179,400 | $232,830 |
| 2020 | $3,934 | $380,120 | $154,400 | $225,720 |
| 2019 | $3,865 | $369,880 | $154,400 | $215,480 |
| 2018 | $3,649 | $336,340 | $139,400 | $196,940 |
| 2017 | $3,598 | $319,850 | $139,400 | $180,450 |
| 2016 | $3,535 | $308,730 | $0 | $0 |
| 2015 | $3,178 | $159,070 | $0 | $159,070 |
| 2014 | $3,135 | $150,510 | $0 | $150,510 |
Source: Public Records
Map
Nearby Homes
- 46440 Beartown Dr
- 113 Connemara Dr
- 21899 Hawksbill High Cir
- 21914 Hawksbill High Cir Unit 304
- 202 E Gordon St
- 1005 N Sterling Blvd
- 46330 Mount Kellogg Terrace
- 400 E Amhurst St
- 11 Coloma Ct
- 46320 Mount Milstead Terrace Unit 301
- 46683 Bartlet Square
- 46823 Gunflint Way
- 21747 Leatherleaf Cir
- 21345 Flatwood Place
- 814 N Croydon St
- 805 N York Rd
- 21228 Mcfadden Square Unit 411
- 21098 Fireside Ct
- 724 N Amelia St
- 21073 Semblance Dr
- 1702 N Amelia St
- 1706 N Amelia St
- 1705 N Brunswick St
- 1703 N Brunswick St
- 1700 N Amelia St
- 1800 N Amelia St
- 1703 N Amelia St
- 1801 N Brunswick St
- 1705 N Amelia St
- 1701 N Brunswick St
- 1701 N Amelia St
- 1801 N Amelia St
- 1803 N Brunswick St
- 1606 N Amelia St
- 1802 N Amelia St
- 1607 N Brunswick St
- 214 Edenberry Ct
- 1803 N Amelia St
- 215 Edenberry Ct
- 1706 N Brunswick St