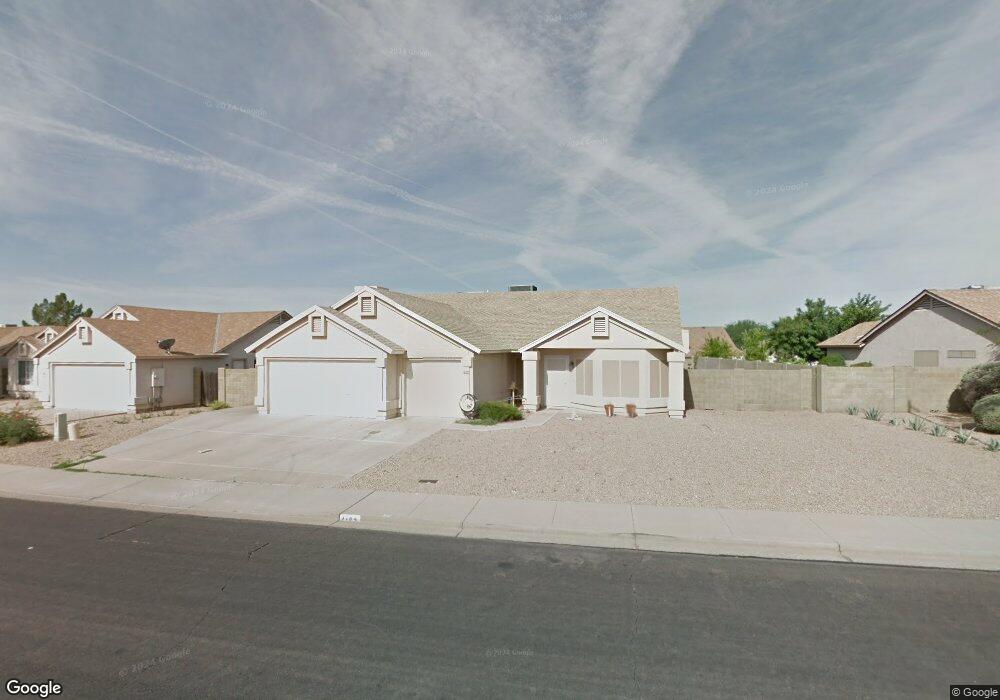
1704 N Ananea Mesa, AZ 85207
Moondance NeighborhoodEstimated Value: $471,556 - $530,000
3
Beds
2
Baths
1,830
Sq Ft
$277/Sq Ft
Est. Value
About This Home
This home is located at 1704 N Ananea, Mesa, AZ 85207 and is currently estimated at $506,389, approximately $276 per square foot. 1704 N Ananea is a home located in Maricopa County with nearby schools including Falcon Hill Elementary School, Franklin at Brimhall Elementary School, and Franklin West Elementary School.
Ownership History
Date
Name
Owned For
Owner Type
Purchase Details
Closed on
Jun 19, 2002
Sold by
Coria Michael J and Coria Madeline M
Bought by
Binkley Arthur C and Binkley Colette D
Current Estimated Value
Home Financials for this Owner
Home Financials are based on the most recent Mortgage that was taken out on this home.
Original Mortgage
$161,317
Interest Rate
6.74%
Mortgage Type
VA
Purchase Details
Closed on
Feb 1, 1995
Sold by
Simonian Martin J
Bought by
Coria Michael J and Coria Madeline M
Home Financials for this Owner
Home Financials are based on the most recent Mortgage that was taken out on this home.
Original Mortgage
$108,300
Interest Rate
9.23%
Mortgage Type
New Conventional
Create a Home Valuation Report for This Property
The Home Valuation Report is an in-depth analysis detailing your home's value as well as a comparison with similar homes in the area
Home Values in the Area
Average Home Value in this Area
Purchase History
| Date | Buyer | Sale Price | Title Company |
|---|---|---|---|
| Binkley Arthur C | $157,000 | Equity Title Agency Inc | |
| Coria Michael J | $114,000 | United Title Agency |
Source: Public Records
Mortgage History
| Date | Status | Borrower | Loan Amount |
|---|---|---|---|
| Previous Owner | Binkley Arthur C | $161,317 | |
| Previous Owner | Coria Michael J | $108,300 |
Source: Public Records
Tax History Compared to Growth
Tax History
| Year | Tax Paid | Tax Assessment Tax Assessment Total Assessment is a certain percentage of the fair market value that is determined by local assessors to be the total taxable value of land and additions on the property. | Land | Improvement |
|---|---|---|---|---|
| 2025 | $1,229 | $19,549 | -- | -- |
| 2024 | $1,723 | $19,548 | -- | -- |
| 2023 | $1,723 | $39,050 | $7,810 | $31,240 |
| 2022 | $1,685 | $28,550 | $5,710 | $22,840 |
| 2021 | $1,732 | $26,680 | $5,330 | $21,350 |
| 2020 | $1,708 | $23,600 | $4,720 | $18,880 |
| 2019 | $1,583 | $21,750 | $4,350 | $17,400 |
| 2018 | $1,511 | $19,730 | $3,940 | $15,790 |
| 2017 | $1,464 | $18,020 | $3,600 | $14,420 |
| 2016 | $1,437 | $17,620 | $3,520 | $14,100 |
| 2015 | $1,357 | $16,570 | $3,310 | $13,260 |
Source: Public Records
Map
Nearby Homes
- 1638 N Avoca
- 1820 N Avoca Cir
- 7436 E Hannibal St Unit 2
- 7442 E Halifax Cir
- 7360 E June St
- 2099 N 77th Place
- 1840 N Brighton Cir Unit 1
- 7259 E Glencove St
- 2225 N 76th Place
- 7006 E Jensen St Unit 123
- 7006 E Jensen St Unit 40
- 7006 E Jensen St Unit 118
- 6961 E Ivyglen St
- 8055 E Jaeger St
- 7114 E Grandview St
- 7560 E Leland Cir
- 2104 N 80th Place
- 8125 E Jaeger St
- 6917 E Ingram Cir
- 8127 E June St