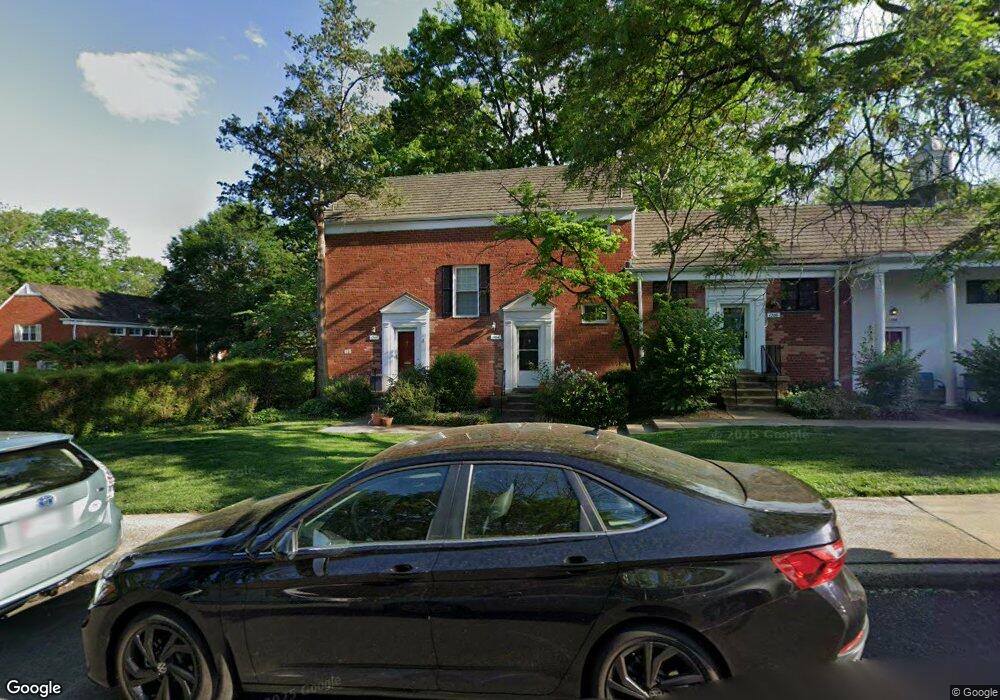
1704 Preston Rd Alexandria, VA 22302
North Ridge NeighborhoodEstimated Value: $331,000 - $334,119
1
Bed
1
Bath
805
Sq Ft
$414/Sq Ft
Est. Value
About This Home
This home is located at 1704 Preston Rd, Alexandria, VA 22302 and is currently estimated at $333,040, approximately $413 per square foot. 1704 Preston Rd is a home located in Alexandria City with nearby schools including Charles Barrett Elementary School, George Washington Middle School, and Alexandria City High School.
Ownership History
Date
Name
Owned For
Owner Type
Purchase Details
Closed on
Feb 28, 2006
Sold by
Reinbacher Karen
Bought by
Harvey Cynthia R
Current Estimated Value
Home Financials for this Owner
Home Financials are based on the most recent Mortgage that was taken out on this home.
Original Mortgage
$61,000
Interest Rate
6.27%
Mortgage Type
Stand Alone Second
Purchase Details
Closed on
Jul 6, 2004
Sold by
Cunningham Dennis
Bought by
Reinbacher Karen
Home Financials for this Owner
Home Financials are based on the most recent Mortgage that was taken out on this home.
Original Mortgage
$199,600
Interest Rate
6.32%
Mortgage Type
New Conventional
Purchase Details
Closed on
Dec 5, 1998
Sold by
Crosbie Scott D
Bought by
Cunningham Dennis E
Home Financials for this Owner
Home Financials are based on the most recent Mortgage that was taken out on this home.
Original Mortgage
$58,200
Interest Rate
6.8%
Create a Home Valuation Report for This Property
The Home Valuation Report is an in-depth analysis detailing your home's value as well as a comparison with similar homes in the area
Home Values in the Area
Average Home Value in this Area
Purchase History
| Date | Buyer | Sale Price | Title Company |
|---|---|---|---|
| Harvey Cynthia R | $305,000 | -- | |
| Reinbacher Karen | $249,500 | -- | |
| Cunningham Dennis E | $60,000 | -- |
Source: Public Records
Mortgage History
| Date | Status | Borrower | Loan Amount |
|---|---|---|---|
| Closed | Harvey Cynthia R | $61,000 | |
| Open | Harvey Cynthia R | $244,000 | |
| Previous Owner | Reinbacher Karen | $199,600 | |
| Previous Owner | Cunningham Dennis E | $58,200 |
Source: Public Records
Tax History Compared to Growth
Tax History
| Year | Tax Paid | Tax Assessment Tax Assessment Total Assessment is a certain percentage of the fair market value that is determined by local assessors to be the total taxable value of land and additions on the property. | Land | Improvement |
|---|---|---|---|---|
| 2025 | $3,412 | $328,327 | $103,409 | $224,918 |
| 2024 | $3,412 | $292,778 | $98,485 | $194,293 |
| 2023 | $3,218 | $289,879 | $97,510 | $192,369 |
| 2022 | $3,155 | $284,195 | $95,598 | $188,597 |
| 2021 | $3,092 | $278,600 | $93,701 | $184,899 |
| 2020 | $2,820 | $253,273 | $85,183 | $168,090 |
| 2019 | $2,700 | $238,936 | $80,361 | $158,575 |
| 2018 | $2,621 | $231,977 | $78,020 | $153,957 |
| 2017 | $2,547 | $225,377 | $75,905 | $149,472 |
| 2016 | $2,468 | $230,000 | $75,905 | $154,095 |
| 2015 | $2,590 | $248,348 | $75,905 | $172,443 |
| 2014 | $2,521 | $241,716 | $75,905 | $165,811 |
Source: Public Records
Map
Nearby Homes
- 1649 Preston Rd
- 3343 Martha Custis Dr
- 3460 Martha Custis Dr
- 1609 Preston Rd
- 3325 Valley Dr
- 3492 Martha Custis Dr
- 3508 Valley Dr
- 3249 Martha Custis Dr Unit 847
- 1640 Fitzgerald Ln
- 3519 Valley Dr
- 3576 Martha Custis Dr
- 3778 Gunston Rd
- 3606 Greenway Place
- 3614 Valley Dr
- 3721 Gunston Rd
- 3106 Ravensworth Place
- 1119 Beverley Dr
- 1121 Allison St
- 1605 Crestwood Dr
- 1242 Martha Custis Dr
- 1704 Preston Rd Unit 815
- 1702 Preston Rd Unit 815
- 1702 Preston Rd
- 1700 Preston Rd
- 1708 Preston Rd
- 1708 Preston Rd Unit 1708
- 1710 Preston Rd
- 1706 Preston Rd
- 1706 Preston Rd Unit 815-1706
- 1712 Preston Rd
- 1712 Preston Rd Unit 1712
- 1714 Preston Rd
- 1714 Preston Rd Unit 1714
- 1660 Preston Rd
- 1662 Preston Rd
- 1716 Preston Rd Unit 815-1716
- 1716 Preston Rd
- 1716 Preston Rd Unit 815-17
- 1658 Preston Rd
- 1718 Preston Rd