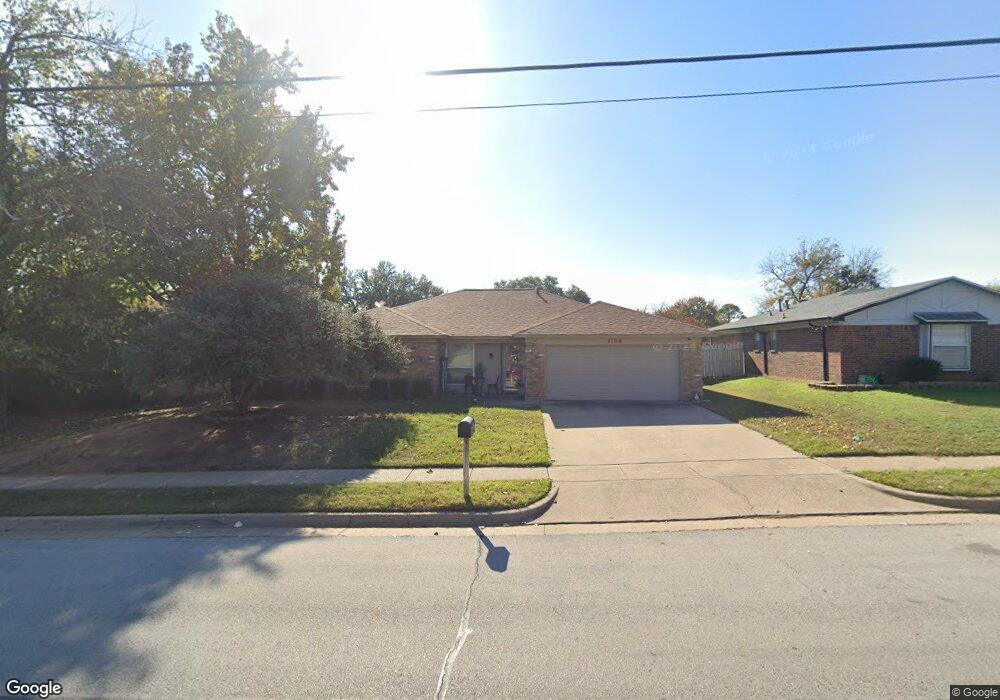
1704 Schumac Ln Bedford, TX 76022
Estimated Value: $326,000 - $350,000
3
Beds
2
Baths
1,556
Sq Ft
$217/Sq Ft
Est. Value
About This Home
This home is located at 1704 Schumac Ln, Bedford, TX 76022 and is currently estimated at $337,396, approximately $216 per square foot. 1704 Schumac Ln is a home located in Tarrant County with nearby schools including Bell Manor Elementary School, Central J High School, and Trinity High School.
Ownership History
Date
Name
Owned For
Owner Type
Purchase Details
Closed on
Nov 11, 2019
Sold by
Sortore John
Bought by
Sortore Candice
Current Estimated Value
Purchase Details
Closed on
Mar 14, 2016
Sold by
Dickey Kristine and Dickey Frank
Bought by
Sortore Candice
Home Financials for this Owner
Home Financials are based on the most recent Mortgage that was taken out on this home.
Original Mortgage
$148,400
Outstanding Balance
$118,002
Interest Rate
3.79%
Mortgage Type
New Conventional
Estimated Equity
$219,394
Purchase Details
Closed on
Feb 18, 2009
Sold by
Gibson Mark Douglas and Gibson Carrie Ann
Bought by
Dickey Kristine and Dickey Frank
Home Financials for this Owner
Home Financials are based on the most recent Mortgage that was taken out on this home.
Original Mortgage
$124,208
Interest Rate
4.91%
Mortgage Type
FHA
Create a Home Valuation Report for This Property
The Home Valuation Report is an in-depth analysis detailing your home's value as well as a comparison with similar homes in the area
Home Values in the Area
Average Home Value in this Area
Purchase History
| Date | Buyer | Sale Price | Title Company |
|---|---|---|---|
| Sortore Candice | -- | None Available | |
| Sortore Candice | -- | Itc | |
| Dickey Kristine | -- | Rattikin Title |
Source: Public Records
Mortgage History
| Date | Status | Borrower | Loan Amount |
|---|---|---|---|
| Open | Sortore Candice | $148,400 | |
| Previous Owner | Dickey Kristine | $124,208 |
Source: Public Records
Tax History Compared to Growth
Tax History
| Year | Tax Paid | Tax Assessment Tax Assessment Total Assessment is a certain percentage of the fair market value that is determined by local assessors to be the total taxable value of land and additions on the property. | Land | Improvement |
|---|---|---|---|---|
| 2025 | $3,953 | $241,512 | $65,000 | $176,512 |
| 2024 | $3,953 | $265,663 | $65,000 | $200,663 |
| 2023 | $3,921 | $309,947 | $45,000 | $264,947 |
| 2022 | $5,262 | $253,643 | $45,000 | $208,643 |
| 2021 | $5,159 | $230,000 | $45,000 | $185,000 |
| 2020 | $4,734 | $219,674 | $45,000 | $174,674 |
| 2019 | $4,397 | $181,000 | $45,000 | $136,000 |
| 2018 | $4,015 | $181,000 | $18,000 | $163,000 |
| 2017 | $4,143 | $171,260 | $18,000 | $153,260 |
| 2016 | $3,622 | $156,918 | $18,000 | $138,918 |
| 2015 | $3,143 | $136,100 | $18,000 | $118,100 |
| 2014 | $3,143 | $136,100 | $18,000 | $118,100 |
Source: Public Records
Map
Nearby Homes
- 1701 Winchester Way
- 1613 Trinity Ct
- 933 Charleston Ct
- 1509 Shirley Way
- 1031 Boston Blvd
- 952 Charleston Dr
- 1004 Overhill Dr
- 2025 Schumac Ln
- 1604 Richmond Dr
- 1204 Edgecliff Dr
- 2201 Greendale Ct
- 921 Overhill Dr
- 2024 Charleston Dr
- 909 Overhill Dr
- 2101 Gettysburg Place
- 1213 Briar Dr
- 804 Natchez Ave
- 1213 Greendale Dr
- 1049 Stableway Ln
- 1116 Highpoint Rd
- 1700 Schumac Ln
- 1708 Schumac Ln
- 1705 Vicksburg Dr
- 1709 Vicksburg Dr
- 1701 Vicksburg Dr
- 1712 Schumac Ln
- 1636 Schumac Ln
- 1713 Vicksburg Dr
- 1633 Vicksburg Dr
- 1716 Schumac Ln
- 1632 Schumac Ln
- 1717 Vicksburg Dr
- 1629 Vicksburg Dr
- 1704 Vicksburg Dr
- 1700 Vicksburg Dr
- 1708 Vicksburg Dr
- 1720 Schumac Ln
- 1628 Schumac Ln
- 1636 Vicksburg Dr
- 1712 Vicksburg Dr