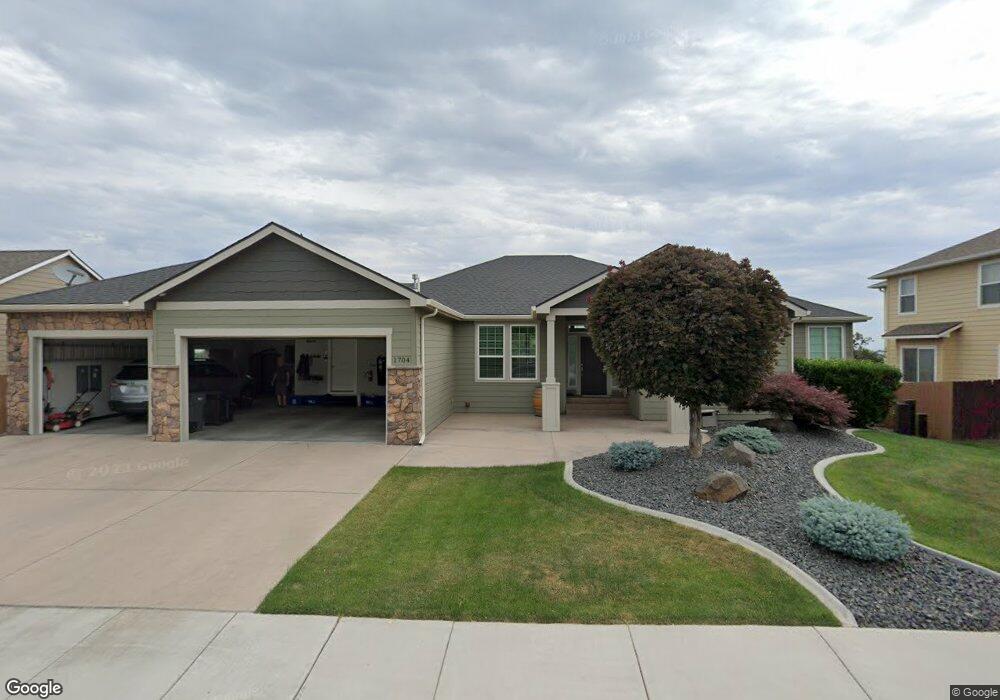
1704 W 51st Ave Unit Spectacular View, Cu Kennewick, WA 99337
Estimated Value: $752,909 - $960,000
4
Beds
4
Baths
2,258
Sq Ft
$369/Sq Ft
Est. Value
About This Home
This home is located at 1704 W 51st Ave Unit Spectacular View, Cu, Kennewick, WA 99337 and is currently estimated at $833,727, approximately $369 per square foot. 1704 W 51st Ave Unit Spectacular View, Cu is a home located in Benton County with nearby schools including Sagecrest Elementary School, Horse Heaven Hills Middle School, and Southridge High School.
Ownership History
Date
Name
Owned For
Owner Type
Purchase Details
Closed on
Mar 29, 2018
Sold by
Bailey Matthew D and Bailey Jessica
Bought by
Grekowicz Randy William and Grekowicz Anne Sofie Fia
Current Estimated Value
Purchase Details
Closed on
Oct 31, 2014
Sold by
Eckman Melissa A and Eckman Todd S
Bought by
Bailey Matthew D and Bailey Jessica
Home Financials for this Owner
Home Financials are based on the most recent Mortgage that was taken out on this home.
Original Mortgage
$377,500
Interest Rate
3.37%
Mortgage Type
Adjustable Rate Mortgage/ARM
Purchase Details
Closed on
Feb 5, 2010
Sold by
Brl Development Llc
Bought by
Eckman Melissa A and Eckman Todd S
Purchase Details
Closed on
Feb 4, 2010
Sold by
Ratchford Bruce W and Ratchford Lorrie A
Bought by
Brl Development Llc
Create a Home Valuation Report for This Property
The Home Valuation Report is an in-depth analysis detailing your home's value as well as a comparison with similar homes in the area
Home Values in the Area
Average Home Value in this Area
Purchase History
| Date | Buyer | Sale Price | Title Company |
|---|---|---|---|
| Grekowicz Randy William | $485,000 | Tri City Title & Escrow Llc | |
| Bailey Matthew D | $447,500 | Stewart Title Co 1 | |
| Eckman Melissa A | $53,000 | Cascade Title | |
| Brl Development Llc | -- | Cascade Title |
Source: Public Records
Mortgage History
| Date | Status | Borrower | Loan Amount |
|---|---|---|---|
| Previous Owner | Bailey Matthew D | $377,500 |
Source: Public Records
Tax History Compared to Growth
Tax History
| Year | Tax Paid | Tax Assessment Tax Assessment Total Assessment is a certain percentage of the fair market value that is determined by local assessors to be the total taxable value of land and additions on the property. | Land | Improvement |
|---|---|---|---|---|
| 2024 | $5,203 | $703,440 | $140,000 | $563,440 |
| 2023 | $5,203 | $654,450 | $140,000 | $514,450 |
| 2022 | $4,899 | $551,330 | $75,000 | $476,330 |
| 2021 | $4,893 | $503,690 | $75,000 | $428,690 |
| 2020 | $4,784 | $487,820 | $75,000 | $412,820 |
| 2019 | $4,353 | $456,060 | $75,000 | $381,060 |
| 2018 | $4,911 | $424,310 | $75,000 | $349,310 |
| 2017 | $4,642 | $391,670 | $90,000 | $301,670 |
| 2016 | $4,719 | $402,060 | $52,800 | $349,260 |
| 2015 | $3,771 | $402,060 | $52,800 | $349,260 |
| 2014 | -- | $318,700 | $52,800 | $265,900 |
| 2013 | -- | $318,700 | $52,800 | $265,900 |
Source: Public Records
Map
Nearby Homes
- 1614 W 51st Ave
- 1591 W 52nd Ave
- 5211 S Palouse Ct -Lot 225
- 5214 S Palouse Ct- Lot 224
- 1503 W 46th Ave
- 1911 W 51st Ave
- 5265 S Quincy Place
- 5289 S Quincy Place
- 5297 S Quincy Place
- TBD S Sharron Ct
- 1052 S Underwood Place
- 1030 S Underwood Place
- 1119 S Underwood Place
- 1097 S Underwood Place
- 1008 S Underwood Place
- 1031 S Underwood Place
- 1141 S Underwood Place
- 1163 S Underwood Place
- 1096 S Underwood Place
- 1162 S Underwood Place
- 1704 W 51st Ave Unit Rambler w/Basement.
- 1704 W 51st Ave Unit Panoramic TriCities
- 1704 W 51st Ave
- 1708 W 51st Ave
- 1700 W 51st Ave
- 1618 W 51st Ave
- 1712 W 51st Ave
- 1703 W 51st Ave Unit REDUCED 20K! Open Fl
- 1703 W 51st Ave Unit Inspiration Estates
- 1703 W 51st Ave
- 1707 W 51st Ave
- 1711 W 51st Ave Unit Beautifully Landscap
- 1711 W 51st Ave Unit Wonderful family hom
- 1711 W 51st Ave
- 1619 W 51st Ave
- 1716 W 51st Ave
- 1715 W 51st Ave
- 1615 W 51st Ave Unit LOOK AT THAT PRICE!!
- 1615 W 51st Ave Unit BEAUTIFUL HOME WITH
- 1615 W 51st Ave