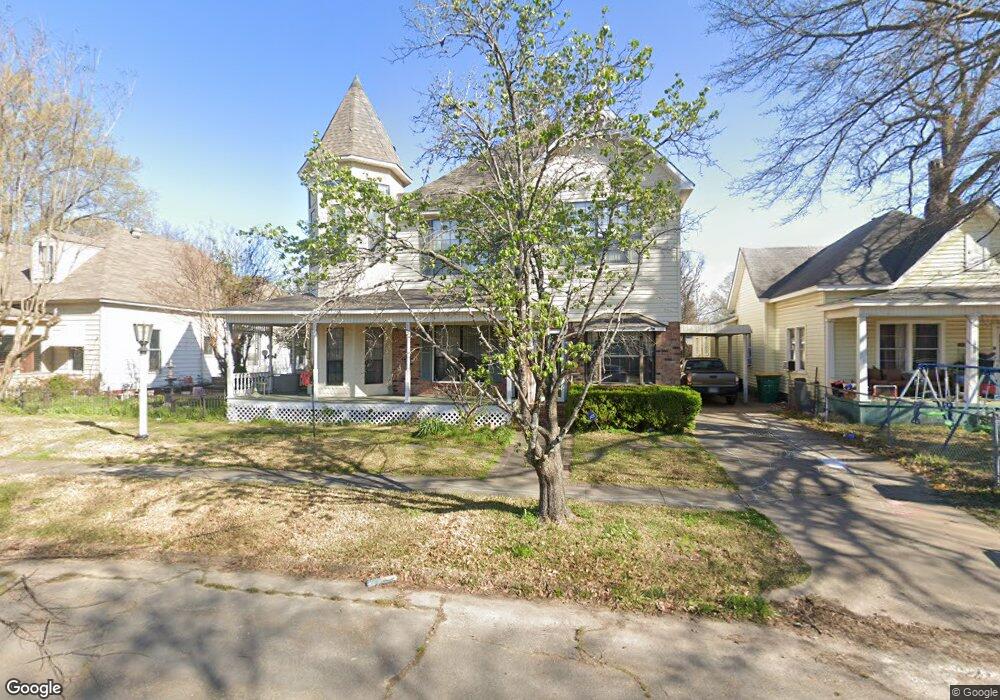
1704 W 9th St Texarkana, TX 75501
Estimated Value: $127,395 - $178,000
--
Bed
--
Bath
3,358
Sq Ft
$44/Sq Ft
Est. Value
About This Home
This home is located at 1704 W 9th St, Texarkana, TX 75501 and is currently estimated at $147,849, approximately $44 per square foot. 1704 W 9th St is a home located in Bowie County with nearby schools including Theron Jones Early Literacy Center, Westlawn Elementary School, and Texas Middle School.
Ownership History
Date
Name
Owned For
Owner Type
Purchase Details
Closed on
Aug 8, 2007
Sold by
Colley Johnny and Colley Sammy
Bought by
Holder Gary W and Holder Donna
Current Estimated Value
Home Financials for this Owner
Home Financials are based on the most recent Mortgage that was taken out on this home.
Original Mortgage
$23,400
Outstanding Balance
$14,732
Interest Rate
6.64%
Mortgage Type
Purchase Money Mortgage
Estimated Equity
$133,117
Create a Home Valuation Report for This Property
The Home Valuation Report is an in-depth analysis detailing your home's value as well as a comparison with similar homes in the area
Home Values in the Area
Average Home Value in this Area
Purchase History
| Date | Buyer | Sale Price | Title Company |
|---|---|---|---|
| Holder Gary W | -- | Stewart Title |
Source: Public Records
Mortgage History
| Date | Status | Borrower | Loan Amount |
|---|---|---|---|
| Open | Holder Gary W | $23,400 |
Source: Public Records
Tax History Compared to Growth
Tax History
| Year | Tax Paid | Tax Assessment Tax Assessment Total Assessment is a certain percentage of the fair market value that is determined by local assessors to be the total taxable value of land and additions on the property. | Land | Improvement |
|---|---|---|---|---|
| 2025 | $757 | $125,003 | $1,500 | $123,503 |
| 2024 | $757 | $139,607 | $1,000 | $138,607 |
| 2023 | $971 | $127,707 | $0 | $0 |
| 2022 | $2,771 | $116,097 | $1,000 | $115,097 |
| 2021 | $2,971 | $116,188 | $1,500 | $114,688 |
| 2020 | $2,846 | $110,804 | $1,500 | $109,304 |
| 2019 | $2,685 | $108,476 | $1,500 | $106,976 |
| 2018 | $2,441 | $104,417 | $1,500 | $102,917 |
| 2017 | $2,213 | $102,433 | $1,500 | $100,933 |
| 2016 | $2,012 | $75,621 | $1,500 | $74,121 |
| 2015 | $1,773 | $74,903 | $1,500 | $73,403 |
| 2014 | $1,773 | $79,191 | $1,500 | $77,691 |
Source: Public Records
Map
Nearby Homes