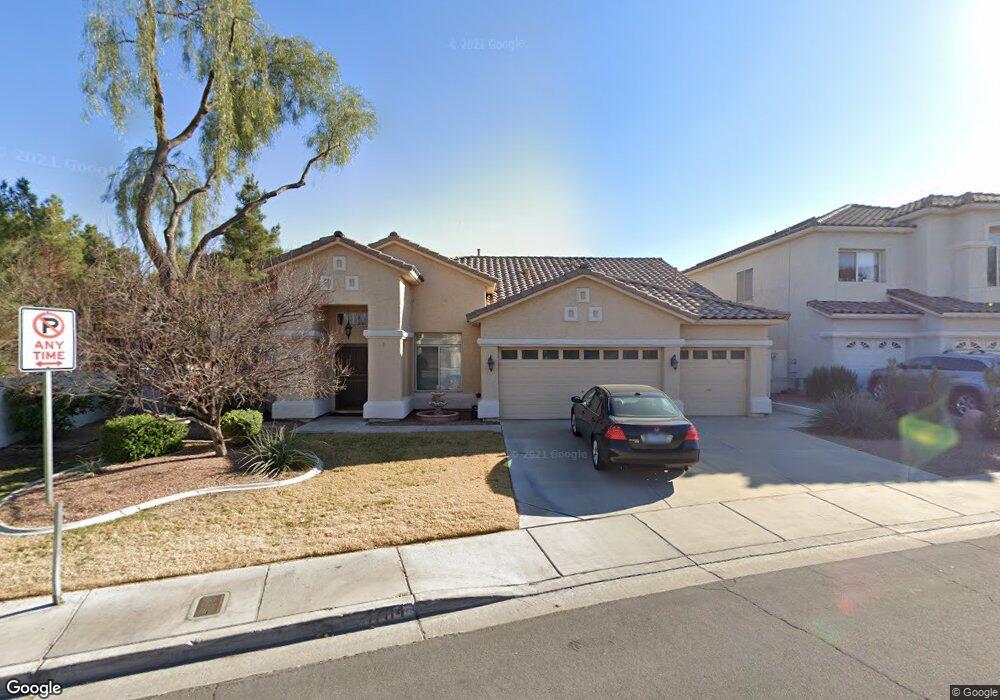
1704 Window Rock Dr Henderson, NV 89074
Green Valley South NeighborhoodEstimated Value: $628,625 - $736,000
4
Beds
2
Baths
2,509
Sq Ft
$271/Sq Ft
Est. Value
About This Home
This home is located at 1704 Window Rock Dr, Henderson, NV 89074 and is currently estimated at $679,406, approximately $270 per square foot. 1704 Window Rock Dr is a home located in Clark County with nearby schools including Selma F Bartlett Elementary School, Barbara and Hank Greenspun Junior High School, and Coronado High School.
Ownership History
Date
Name
Owned For
Owner Type
Purchase Details
Closed on
Jun 21, 2011
Sold by
Wayman Mark W
Bought by
Teske Steve R
Current Estimated Value
Home Financials for this Owner
Home Financials are based on the most recent Mortgage that was taken out on this home.
Original Mortgage
$91,000
Outstanding Balance
$6,173
Interest Rate
4.56%
Mortgage Type
New Conventional
Estimated Equity
$673,233
Purchase Details
Closed on
Apr 20, 2011
Sold by
Wayman Mark W and Wayman Susan M
Bought by
Wayman Mark W
Purchase Details
Closed on
Nov 14, 2000
Sold by
Morris Donald L and Morris Joan E
Bought by
Wayman Mark W and Wayman Susan M
Home Financials for this Owner
Home Financials are based on the most recent Mortgage that was taken out on this home.
Original Mortgage
$201,600
Interest Rate
7.65%
Purchase Details
Closed on
Jun 27, 1996
Sold by
Beazer Homes Holdings Corp
Bought by
Morris Donald L and Morris Joan E
Create a Home Valuation Report for This Property
The Home Valuation Report is an in-depth analysis detailing your home's value as well as a comparison with similar homes in the area
Home Values in the Area
Average Home Value in this Area
Purchase History
| Date | Buyer | Sale Price | Title Company |
|---|---|---|---|
| Teske Steve R | $241,000 | Chicago Title Las Vegas | |
| Wayman Mark W | -- | None Available | |
| Wayman Mark W | $252,000 | Fidelity National Title | |
| Morris Donald L | $216,500 | First American Title Co |
Source: Public Records
Mortgage History
| Date | Status | Borrower | Loan Amount |
|---|---|---|---|
| Open | Teske Steve R | $91,000 | |
| Previous Owner | Wayman Mark W | $201,600 |
Source: Public Records
Tax History Compared to Growth
Tax History
| Year | Tax Paid | Tax Assessment Tax Assessment Total Assessment is a certain percentage of the fair market value that is determined by local assessors to be the total taxable value of land and additions on the property. | Land | Improvement |
|---|---|---|---|---|
| 2025 | $2,845 | $146,363 | $51,800 | $94,563 |
| 2024 | $2,763 | $146,363 | $51,800 | $94,563 |
| 2023 | $2,254 | $144,309 | $54,250 | $90,059 |
| 2022 | $2,682 | $126,579 | $44,100 | $82,479 |
| 2021 | $2,604 | $119,319 | $40,600 | $78,719 |
| 2020 | $2,526 | $117,220 | $39,200 | $78,020 |
| 2019 | $2,452 | $112,001 | $35,000 | $77,001 |
| 2018 | $2,381 | $105,320 | $30,800 | $74,520 |
| 2017 | $3,090 | $106,605 | $30,800 | $75,805 |
| 2016 | $2,254 | $97,705 | $21,315 | $76,390 |
| 2015 | $2,250 | $86,276 | $20,580 | $65,696 |
| 2014 | $2,180 | $73,010 | $14,700 | $58,310 |
Source: Public Records
Map
Nearby Homes
- 36 Palazzo Terrace
- 1679 Long Horizon Ln
- 54 Ancient Hills Ln
- 90 Ancient Hills Ln
- 59 Desert Dawn Ln
- 1553 Sea Sunset Ct
- 75 N Valle Verde Dr Unit 823
- 75 N Valle Verde Dr Unit 524
- 75 N Valle Verde Dr Unit 1822
- 75 N Valle Verde Dr Unit 2121
- 75 N Valle Verde Dr Unit 225
- 75 N Valle Verde Dr Unit 211
- 75 N Valle Verde Dr Unit 621
- 1557 Blue Sierra Ct Unit 1
- 1525 Spiced Wine Ave Unit 24104
- 1525 Spiced Wine Ave Unit 12103
- 1525 Spiced Wine Ave Unit 27104
- 1525 Spiced Wine Ave Unit 14101
- 1525 Spiced Wine Ave Unit 19103
- 1713 Chris Ave
- 1706 Window Rock Dr
- 1708 Window Rock Dr
- 1705 Window Rock Dr
- 1703 Window Rock Dr
- 1707 Window Rock Dr
- 1710 Window Rock Dr
- 1701 Window Rock Dr
- 54 Coyote Pointe Ct
- 1701 Sun Shower Ct
- 35 Desert Dawn Ln
- 1709 Window Rock Dr
- 37 Desert Dawn Ln
- 39 Desert Dawn Ln
- 33 Desert Dawn Ln
- 1700 Sun Shower Ct
- 1703 Sun Shower Ct
- 1711 Window Rock Dr
- 52 Coyote Pointe Ct
- 55 Coyote Pointe Ct
- 31 Desert Dawn Ln