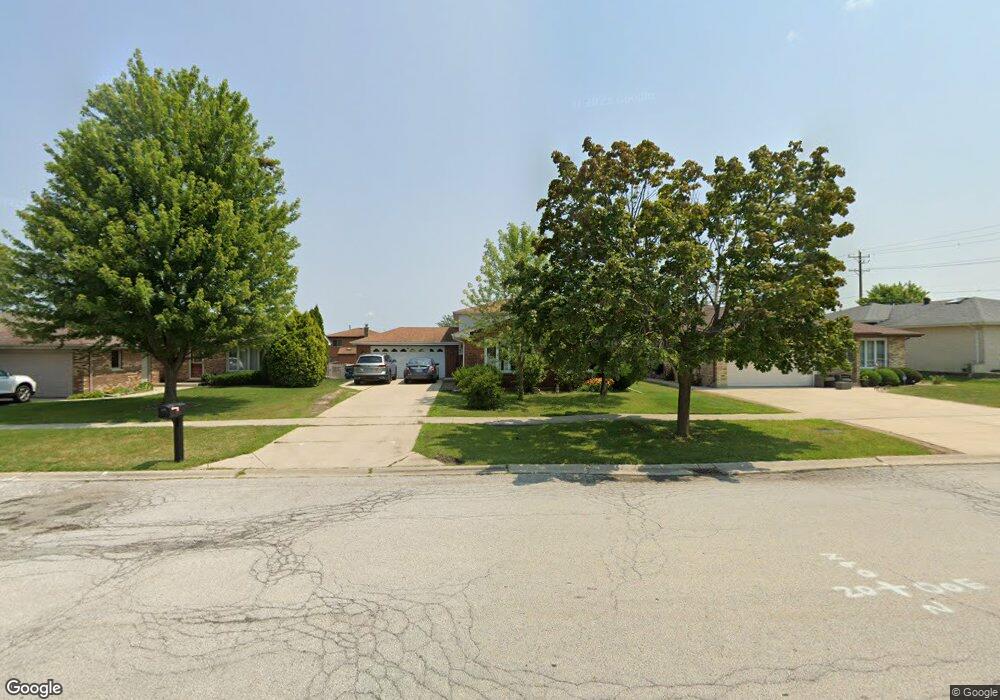
17049 92nd Ave Orland Hills, IL 60487
Estimated Value: $394,000 - $440,000
4
Beds
3
Baths
1,947
Sq Ft
$217/Sq Ft
Est. Value
About This Home
This home is located at 17049 92nd Ave, Orland Hills, IL 60487 and is currently estimated at $422,890, approximately $217 per square foot. 17049 92nd Ave is a home located in Cook County with nearby schools including Fernway Park Elementary School, Prairie View Middle School, and Victor J Andrew High School.
Ownership History
Date
Name
Owned For
Owner Type
Purchase Details
Closed on
Sep 22, 2003
Sold by
Lopez Alfredo and Lopez Anna M
Bought by
Bolek Louis M and Bolek Michelle L
Current Estimated Value
Home Financials for this Owner
Home Financials are based on the most recent Mortgage that was taken out on this home.
Original Mortgage
$250,950
Outstanding Balance
$117,935
Interest Rate
6.43%
Mortgage Type
Unknown
Estimated Equity
$304,955
Purchase Details
Closed on
Jul 21, 2000
Sold by
Swatkowski Richard D and Swatkowski Peggy A
Bought by
Lopez Alfredo and Lopez Anna M
Home Financials for this Owner
Home Financials are based on the most recent Mortgage that was taken out on this home.
Original Mortgage
$173,800
Interest Rate
8.27%
Purchase Details
Closed on
May 24, 1995
Sold by
U S Bank
Bought by
Swatkowski Richard D and Swatkowski Peggy A
Home Financials for this Owner
Home Financials are based on the most recent Mortgage that was taken out on this home.
Original Mortgage
$159,900
Interest Rate
8.26%
Create a Home Valuation Report for This Property
The Home Valuation Report is an in-depth analysis detailing your home's value as well as a comparison with similar homes in the area
Home Values in the Area
Average Home Value in this Area
Purchase History
| Date | Buyer | Sale Price | Title Company |
|---|---|---|---|
| Bolek Louis M | $251,000 | Multiple | |
| Lopez Alfredo | $183,000 | -- | |
| Swatkowski Richard D | $168,500 | -- |
Source: Public Records
Mortgage History
| Date | Status | Borrower | Loan Amount |
|---|---|---|---|
| Open | Bolek Louis M | $250,950 | |
| Previous Owner | Lopez Alfredo | $173,800 | |
| Previous Owner | Swatkowski Richard D | $159,900 |
Source: Public Records
Tax History Compared to Growth
Tax History
| Year | Tax Paid | Tax Assessment Tax Assessment Total Assessment is a certain percentage of the fair market value that is determined by local assessors to be the total taxable value of land and additions on the property. | Land | Improvement |
|---|---|---|---|---|
| 2024 | $8,377 | $34,001 | $5,063 | $28,938 |
| 2023 | $7,094 | $34,001 | $5,063 | $28,938 |
| 2022 | $7,094 | $23,863 | $4,125 | $19,738 |
| 2021 | $6,796 | $23,863 | $4,125 | $19,738 |
| 2020 | $6,616 | $23,863 | $4,125 | $19,738 |
| 2019 | $7,104 | $26,417 | $3,750 | $22,667 |
| 2018 | $6,880 | $26,417 | $3,750 | $22,667 |
| 2017 | $6,660 | $26,417 | $3,750 | $22,667 |
| 2016 | $7,123 | $24,930 | $3,375 | $21,555 |
| 2015 | $7,009 | $24,930 | $3,375 | $21,555 |
| 2014 | $6,944 | $24,930 | $3,375 | $21,555 |
| 2013 | $6,624 | $25,662 | $3,375 | $22,287 |
Source: Public Records
Map
Nearby Homes
- 17018 93rd Ave
- 16950 90th Ave
- 17230 Shetland Dr
- 16805 Hilltop Ave
- 16779 92nd Ave
- 17224 Briar Dr
- 9413 Caledonia Dr
- 16753 91st Ave
- 16753 Hilltop Ave
- 16813 89th Ave
- 16701 Highview Ave
- 9404 Lindsay St
- 8750 W 169th St
- 9201 175th St
- 8721 W 169th St
- 9334 Drummond Dr Unit 3
- 17533 Pecan Ln
- 9260 Windsor Pkwy Unit 80
- 8710 W 168th St
- 9280 Windsor Pkwy Unit 92
- 17043 92nd Ave
- 17055 92nd Ave
- 17054 Westwood Dr
- 17037 92nd Ave
- 17061 92nd Ave
- 17048 Westwood Dr
- 17060 Westwood Dr
- 17042 Westwood Dr
- 17031 92nd Ave
- 17042 92nd Ave Unit 4
- 17060 92nd Ave
- 17036 Westwood Dr
- 9119 Westwood Dr
- 17036 92nd Ave
- 17025 92nd Ave
- 9207 170th Place
- 17030 Westwood Dr
- 9113 Westwood Dr
- 9216 170th Place
- 17030 92nd Ave