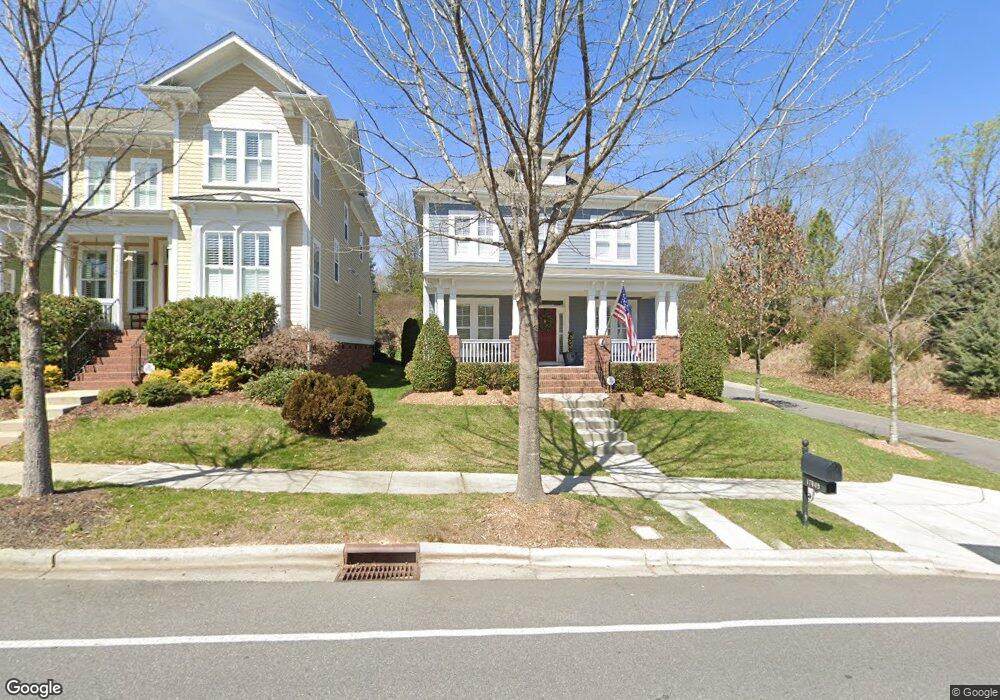
17049 Summers Walk Blvd Davidson, NC 28036
Estimated Value: $527,750 - $649,000
4
Beds
4
Baths
2,510
Sq Ft
$237/Sq Ft
Est. Value
About This Home
This home is located at 17049 Summers Walk Blvd, Davidson, NC 28036 and is currently estimated at $593,688, approximately $236 per square foot. 17049 Summers Walk Blvd is a home located in Mecklenburg County with nearby schools including Davidson Elementary School, William Amos Hough High School, and Bonnie Cone Leadership Academy.
Ownership History
Date
Name
Owned For
Owner Type
Purchase Details
Closed on
Mar 1, 2013
Sold by
Benkovich Joseph M and Lamanna Angela R
Bought by
Benkovich Joseph M and Benkovich Angela
Current Estimated Value
Home Financials for this Owner
Home Financials are based on the most recent Mortgage that was taken out on this home.
Original Mortgage
$182,350
Outstanding Balance
$37,247
Interest Rate
3.43%
Mortgage Type
New Conventional
Estimated Equity
$556,441
Purchase Details
Closed on
Sep 28, 2007
Sold by
Mid Atlantic Homes Llc
Bought by
Benkovich Joseph M and Lamanna Angela R
Home Financials for this Owner
Home Financials are based on the most recent Mortgage that was taken out on this home.
Original Mortgage
$201,000
Interest Rate
6.57%
Mortgage Type
Purchase Money Mortgage
Purchase Details
Closed on
May 4, 2007
Sold by
Fc Summers Walk Llc
Bought by
Mid Atlantic Homes Llc
Create a Home Valuation Report for This Property
The Home Valuation Report is an in-depth analysis detailing your home's value as well as a comparison with similar homes in the area
Home Values in the Area
Average Home Value in this Area
Purchase History
| Date | Buyer | Sale Price | Title Company |
|---|---|---|---|
| Benkovich Joseph M | -- | None Available | |
| Benkovich Joseph M | $301,500 | None Available | |
| Mid Atlantic Homes Llc | $123,000 | None Available |
Source: Public Records
Mortgage History
| Date | Status | Borrower | Loan Amount |
|---|---|---|---|
| Open | Benkovich Joseph M | $182,350 | |
| Closed | Benkovich Joseph M | $201,000 |
Source: Public Records
Tax History Compared to Growth
Tax History
| Year | Tax Paid | Tax Assessment Tax Assessment Total Assessment is a certain percentage of the fair market value that is determined by local assessors to be the total taxable value of land and additions on the property. | Land | Improvement |
|---|---|---|---|---|
| 2025 | -- | $451,900 | $67,500 | $384,400 |
| 2024 | -- | $451,900 | $67,500 | $384,400 |
| 2023 | $3,384 | $451,900 | $67,500 | $384,400 |
| 2022 | $2,772 | $290,100 | $60,000 | $230,100 |
| 2021 | $2,871 | $290,100 | $60,000 | $230,100 |
| 2020 | $2,871 | $290,100 | $60,000 | $230,100 |
| 2019 | $2,865 | $290,100 | $60,000 | $230,100 |
| 2018 | $3,200 | $253,300 | $50,000 | $203,300 |
| 2017 | $3,178 | $253,300 | $50,000 | $203,300 |
| 2016 | $3,174 | $253,300 | $50,000 | $203,300 |
| 2015 | $3,171 | $253,300 | $50,000 | $203,300 |
| 2014 | $3,169 | $0 | $0 | $0 |
Source: Public Records
Map
Nearby Homes
- 15816 Sharon Dale Dr
- 16918 Summers Walk Blvd
- 15879 Sharon Dale Dr
- 13713 Helen Benson Blvd
- 13717 Helen Benson Blvd
- 17431 Summers Walk Blvd
- 14510 Grundys Way
- 17925 Stuttgart Rd
- 16909 Setter Point Ln
- 3556 Catherine Creek Place
- 18308 Shearer Rd
- 16714 Setter Point Ln
- 10900 Tailwater St
- 10907 Tailwater St
- 10913 Tailwater St
- 1502 Coffeetree Dr NW
- 10600 Davidson Hwy
- 10997 Alabaster Dr
- 15603 June Washam Rd
- 10901 Trout Creek Place
- 17041 Summers Walk Blvd
- 17031 Summers Walk Blvd
- 17027 Summers Walk Blvd
- 17048 Summers Walk Blvd Unit 60
- 17048 Summers Walk Blvd
- 17044 Summers Walk Blvd Unit 59
- 17044 Summers Walk Blvd
- 17036 Summers Walk Blvd Unit 57
- 17036 Summers Walk Blvd
- 17036 Summers Walk Blvd Unit 17036
- 17023 Summers Walk Blvd
- 17040 Summers Walk Blvd Unit 58
- 17040 Summers Walk Blvd
- 17028 Summers Walk Blvd Unit 55
- 17028 Summers Walk Blvd
- 17032 Summers Walk Blvd Unit 56
- 17032 Summers Walk Blvd
- 17015 Summers Walk Blvd
- 17022 Summers Walk Blvd
- 17018 Summers Walk Blvd