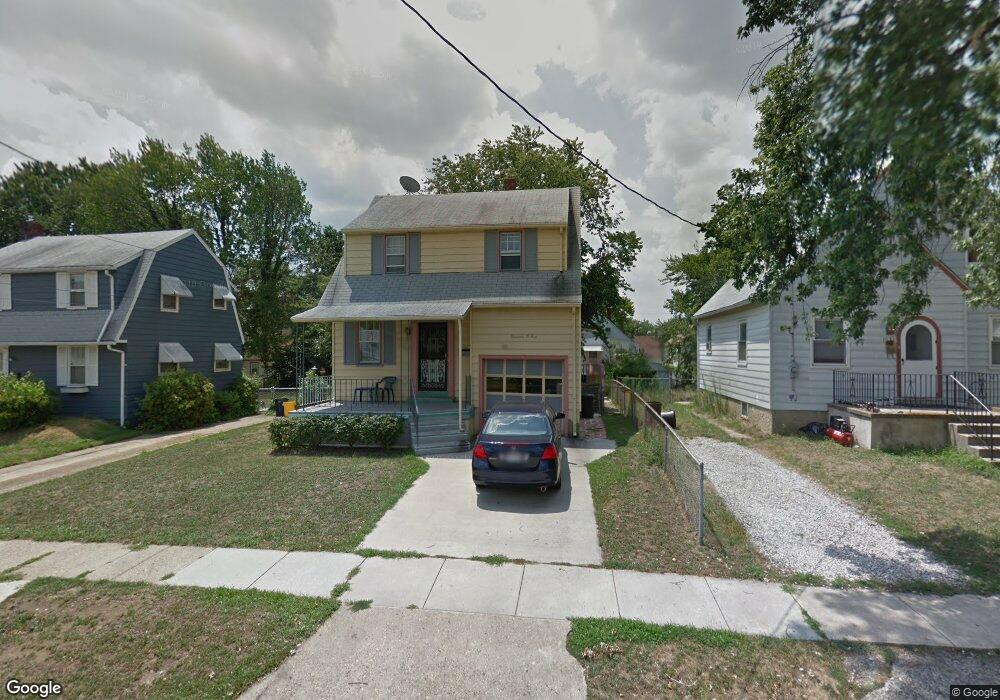
1705 44th St Pennsauken, NJ 08110
Estimated Value: $302,758 - $326,000
--
Bed
--
Bath
1,154
Sq Ft
$277/Sq Ft
Est. Value
About This Home
This home is located at 1705 44th St, Pennsauken, NJ 08110 and is currently estimated at $319,190, approximately $276 per square foot. 1705 44th St is a home located in Camden County with nearby schools including Pennsauken High School, Camdens Promise Charter School, and St. Cecilia School.
Ownership History
Date
Name
Owned For
Owner Type
Purchase Details
Closed on
Aug 11, 2023
Sold by
Le Du and Le Duy
Bought by
Le Du and Bui Phuong Ngoc
Current Estimated Value
Purchase Details
Closed on
Jul 29, 2008
Sold by
Le Duyen
Bought by
Le Du
Home Financials for this Owner
Home Financials are based on the most recent Mortgage that was taken out on this home.
Original Mortgage
$152,000
Interest Rate
6.4%
Mortgage Type
FHA
Purchase Details
Closed on
Jul 25, 2003
Sold by
Person Jean
Bought by
Le Du and Le Duyen
Home Financials for this Owner
Home Financials are based on the most recent Mortgage that was taken out on this home.
Original Mortgage
$110,000
Interest Rate
5.52%
Mortgage Type
FHA
Create a Home Valuation Report for This Property
The Home Valuation Report is an in-depth analysis detailing your home's value as well as a comparison with similar homes in the area
Home Values in the Area
Average Home Value in this Area
Purchase History
| Date | Buyer | Sale Price | Title Company |
|---|---|---|---|
| Le Du | -- | None Listed On Document | |
| Le Du | -- | None Listed On Document | |
| Le Du | -- | -- | |
| Le Du | $110,900 | -- |
Source: Public Records
Mortgage History
| Date | Status | Borrower | Loan Amount |
|---|---|---|---|
| Previous Owner | Le Du | $152,000 | |
| Previous Owner | Le Du | $110,000 |
Source: Public Records
Tax History Compared to Growth
Tax History
| Year | Tax Paid | Tax Assessment Tax Assessment Total Assessment is a certain percentage of the fair market value that is determined by local assessors to be the total taxable value of land and additions on the property. | Land | Improvement |
|---|---|---|---|---|
| 2025 | $5,083 | $284,700 | $53,000 | $231,700 |
| 2024 | $4,985 | $116,800 | $38,500 | $78,300 |
| 2023 | $4,985 | $116,800 | $38,500 | $78,300 |
| 2022 | $4,507 | $116,800 | $38,500 | $78,300 |
| 2021 | $4,629 | $116,800 | $38,500 | $78,300 |
| 2020 | $4,146 | $116,800 | $38,500 | $78,300 |
| 2019 | $4,194 | $116,800 | $38,500 | $78,300 |
| 2018 | $4,216 | $116,800 | $38,500 | $78,300 |
| 2017 | $4,225 | $116,800 | $38,500 | $78,300 |
| 2016 | $4,149 | $116,800 | $38,500 | $78,300 |
| 2015 | $4,273 | $116,800 | $38,500 | $78,300 |
| 2014 | $3,871 | $69,600 | $18,700 | $50,900 |
Source: Public Records
Map
Nearby Homes