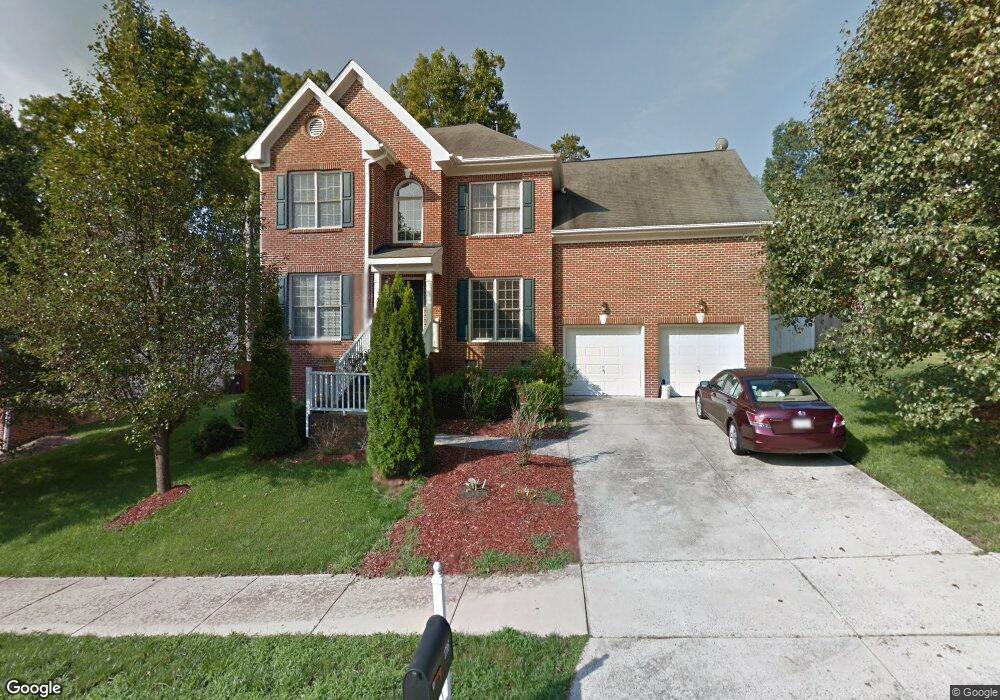
1705 Autumn Ridge Dr Durham, NC 27712
Estimated Value: $498,369 - $535,000
4
Beds
3
Baths
2,488
Sq Ft
$210/Sq Ft
Est. Value
About This Home
This home is located at 1705 Autumn Ridge Dr, Durham, NC 27712 and is currently estimated at $522,842, approximately $210 per square foot. 1705 Autumn Ridge Dr is a home located in Durham County with nearby schools including Eno Valley Elementary, George L Carrington Middle, and Northern High School.
Ownership History
Date
Name
Owned For
Owner Type
Purchase Details
Closed on
Aug 4, 2020
Sold by
Bang Ngoc and Bang Quyen P
Bought by
Kennedy Brian and Kennedy Brianna
Current Estimated Value
Home Financials for this Owner
Home Financials are based on the most recent Mortgage that was taken out on this home.
Original Mortgage
$337,900
Interest Rate
4.37%
Mortgage Type
New Conventional
Purchase Details
Closed on
Feb 23, 2011
Sold by
Bang Hue Chan and Pham Tam Thi Thu
Bought by
Bang Ngoc and Bang Quyen P
Home Financials for this Owner
Home Financials are based on the most recent Mortgage that was taken out on this home.
Original Mortgage
$170,000
Interest Rate
4.66%
Mortgage Type
New Conventional
Purchase Details
Closed on
Dec 19, 2003
Sold by
St Lawrence Homes Inc
Bought by
Bang Hue Chan and Bang Quyen P
Home Financials for this Owner
Home Financials are based on the most recent Mortgage that was taken out on this home.
Original Mortgage
$185,000
Interest Rate
5.97%
Mortgage Type
Purchase Money Mortgage
Create a Home Valuation Report for This Property
The Home Valuation Report is an in-depth analysis detailing your home's value as well as a comparison with similar homes in the area
Home Values in the Area
Average Home Value in this Area
Purchase History
| Date | Buyer | Sale Price | Title Company |
|---|---|---|---|
| Kennedy Brian | -- | None Available | |
| Kennedy Brian | -- | None Available | |
| Bang Ngoc | -- | None Available | |
| Bang Hue Chan | $232,500 | -- |
Source: Public Records
Mortgage History
| Date | Status | Borrower | Loan Amount |
|---|---|---|---|
| Previous Owner | Kennedy Brian | $337,900 | |
| Previous Owner | Bang Ngoc | $170,000 | |
| Previous Owner | Bang Hue Chan | $185,000 |
Source: Public Records
Tax History Compared to Growth
Tax History
| Year | Tax Paid | Tax Assessment Tax Assessment Total Assessment is a certain percentage of the fair market value that is determined by local assessors to be the total taxable value of land and additions on the property. | Land | Improvement |
|---|---|---|---|---|
| 2025 | $3,824 | $487,583 | $81,250 | $406,333 |
| 2024 | $3,824 | $274,124 | $55,250 | $218,874 |
| 2023 | $3,591 | $274,124 | $55,250 | $218,874 |
| 2022 | $3,509 | $274,124 | $55,250 | $218,874 |
| 2021 | $3,492 | $274,124 | $55,250 | $218,874 |
| 2020 | $3,410 | $274,124 | $55,250 | $218,874 |
| 2019 | $3,410 | $274,124 | $55,250 | $218,874 |
| 2018 | $3,210 | $236,634 | $45,500 | $191,134 |
| 2017 | $3,186 | $236,634 | $45,500 | $191,134 |
| 2016 | $3,079 | $236,634 | $45,500 | $191,134 |
| 2015 | $3,420 | $247,086 | $57,946 | $189,140 |
| 2014 | $3,420 | $247,086 | $57,946 | $189,140 |
Source: Public Records
Map
Nearby Homes
- 210 Accura Ct
- 5603 Ventura Dr
- 1819 Grady Dr
- 2110 Bivins Rd
- 1813 Grady Dr
- 4908 Mandel Rd
- 2009 Eden Shire Way
- 1601 Redmond Dr
- 120 Chattleton Ct
- 122 Stedwick Place
- 1139 Sawmill Ln
- 1143 Sawmill Ln
- 2417 Bivins Rd
- 2423 Bivins Rd
- 113 Laurston Ct
- 5610 Genesee Dr
- 7 Starwood Ln
- 5601 Guess Rd
- 20 Indigo Creek Trail
- 202 Brook Ln
- 1703 Autumn Ridge Dr
- 1707 Autumn Ridge Dr
- 1709 Autumn Ridge Dr
- 1701 Autumn Ridge Dr
- 1704 Autumn Ridge Dr
- 1706 Autumn Ridge Dr
- 1702 Autumn Ridge Dr
- 1708 Autumn Ridge Dr
- 5510 Carey Place
- 1613 Autumn Ridge Dr
- 1710 Autumn Ridge Dr
- 1605 Crystal Creek Dr
- 1612 Autumn Ridge Dr
- 207 Accura Ct
- 6 Corktree Ct
- 5601 Carey Place
- 5601 Carey Place
- 5 Corktree Ct
- 5606 Carey Place
- 1611 Autumn Ridge Dr