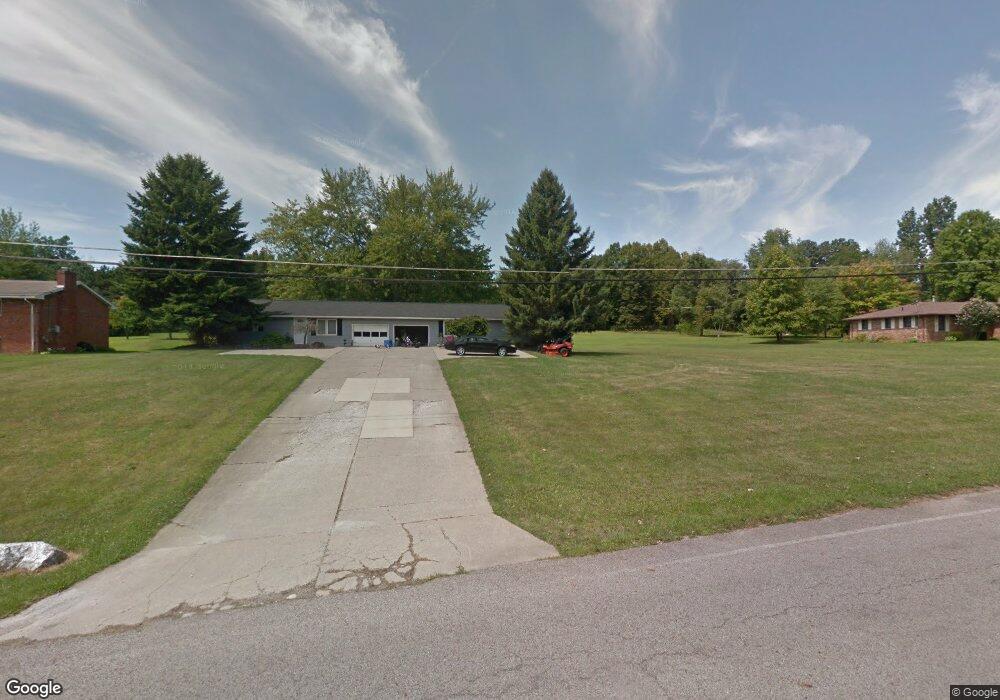
1705 Beal Rd Mansfield, OH 44903
Estimated Value: $190,000 - $232,567
4
Beds
2
Baths
1,560
Sq Ft
$136/Sq Ft
Est. Value
About This Home
This home is located at 1705 Beal Rd, Mansfield, OH 44903 and is currently estimated at $212,392, approximately $136 per square foot. 1705 Beal Rd is a home located in Richland County with nearby schools including Madison High School, Temple-Christian School, and St. Mary Catholic School.
Ownership History
Date
Name
Owned For
Owner Type
Purchase Details
Closed on
Apr 8, 2021
Sold by
Frasz Jonathan T
Bought by
Hurst Aaron M
Current Estimated Value
Home Financials for this Owner
Home Financials are based on the most recent Mortgage that was taken out on this home.
Original Mortgage
$124,000
Outstanding Balance
$110,589
Interest Rate
3.05%
Mortgage Type
Credit Line Revolving
Estimated Equity
$101,803
Purchase Details
Closed on
Jun 30, 2006
Sold by
Schag Matthew R
Bought by
Frasz Jonathan T
Home Financials for this Owner
Home Financials are based on the most recent Mortgage that was taken out on this home.
Original Mortgage
$105,839
Interest Rate
6.73%
Mortgage Type
FHA
Purchase Details
Closed on
Jul 30, 2001
Sold by
Burbach Phillip
Bought by
Schag Matthew R
Home Financials for this Owner
Home Financials are based on the most recent Mortgage that was taken out on this home.
Original Mortgage
$81,000
Interest Rate
6.75%
Mortgage Type
New Conventional
Create a Home Valuation Report for This Property
The Home Valuation Report is an in-depth analysis detailing your home's value as well as a comparison with similar homes in the area
Home Values in the Area
Average Home Value in this Area
Purchase History
| Date | Buyer | Sale Price | Title Company |
|---|---|---|---|
| Hurst Aaron M | $155,000 | Stonegate Title Agency | |
| Hurst Aaron M | $155,000 | Stonegate Title Agency | |
| Frasz Jonathan T | $107,500 | Chicago Title | |
| Frasz Jonathan T | $107,500 | Chicago Title | |
| Schag Matthew R | $90,000 | -- | |
| Schag Matthew R | $90,000 | -- |
Source: Public Records
Mortgage History
| Date | Status | Borrower | Loan Amount |
|---|---|---|---|
| Open | Hurst Aaron M | $124,000 | |
| Previous Owner | Frasz Jonathan T | $105,839 | |
| Previous Owner | Schag Matthew R | $81,000 |
Source: Public Records
Tax History
| Year | Tax Paid | Tax Assessment Tax Assessment Total Assessment is a certain percentage of the fair market value that is determined by local assessors to be the total taxable value of land and additions on the property. | Land | Improvement |
|---|---|---|---|---|
| 2025 | $2,635 | $53,180 | $13,130 | $40,050 |
| 2024 | $2,635 | $53,180 | $13,130 | $40,050 |
| 2023 | $2,635 | $53,180 | $13,130 | $40,050 |
| 2022 | $2,320 | $41,460 | $11,740 | $29,720 |
| 2021 | $2,292 | $41,460 | $11,740 | $29,720 |
| 2020 | $2,310 | $41,460 | $11,740 | $29,720 |
| 2019 | $2,202 | $35,140 | $9,950 | $25,190 |
| 2018 | $2,060 | $35,140 | $9,950 | $25,190 |
| 2017 | $2,040 | $35,140 | $9,950 | $25,190 |
| 2016 | $2,063 | $34,720 | $9,450 | $25,270 |
| 2015 | $1,968 | $34,720 | $9,450 | $25,270 |
| 2014 | $1,961 | $34,720 | $9,450 | $25,270 |
| 2012 | $975 | $36,550 | $9,950 | $26,600 |
Source: Public Records
Map
Nearby Homes
- 961 Neil Cir N
- 690 Ashland Rd
- 1440 Barbara Ln
- 888 Beal Rd
- 573 Caldwell Ave
- 1990 Woodmont Rd
- 0 Wesley
- 943 Yale Ave
- 1168 ConcheMcO St
- 684 N Mcelroy Rd
- 1217 Evergreen Ave W
- 683 Coachman Rd
- 672 Coachman Rd
- 1226 Evergreen Ave W
- 644 Skyline Rd
- 646 Fleetwood Rd
- 632 Coachman Rd
- 602 Champion Rd
- 615 Champion Rd
- 607 Skyline Rd
- 1710 Beal Rd
- 1703 Beal Rd Unit 1705
- 1703 1705 Beal Rd
- 1693 Beal Rd
- 1691 Beal Rd Unit 1693
- 1725 Beal Rd
- 1694 Beal Rd
- 1735 Beal Rd
- 1681 Beal Rd
- 1760 Beal Rd
- 1677 Beal Rd
- 1745 Beal Rd
- 1240 Bentwood Ct
- 1286 Bentwood Ct
- 1656 Beal Rd
- 1656 Beal Rd Unit 1656 Beal Road
- 1656 Beal Rd Unit 1658 Beal Road
- 1679 Anglewood Dr
- 1683-1689 Anglewood Dr
- 1683 Anglewood Dr
Your Personal Tour Guide
Ask me questions while you tour the home.