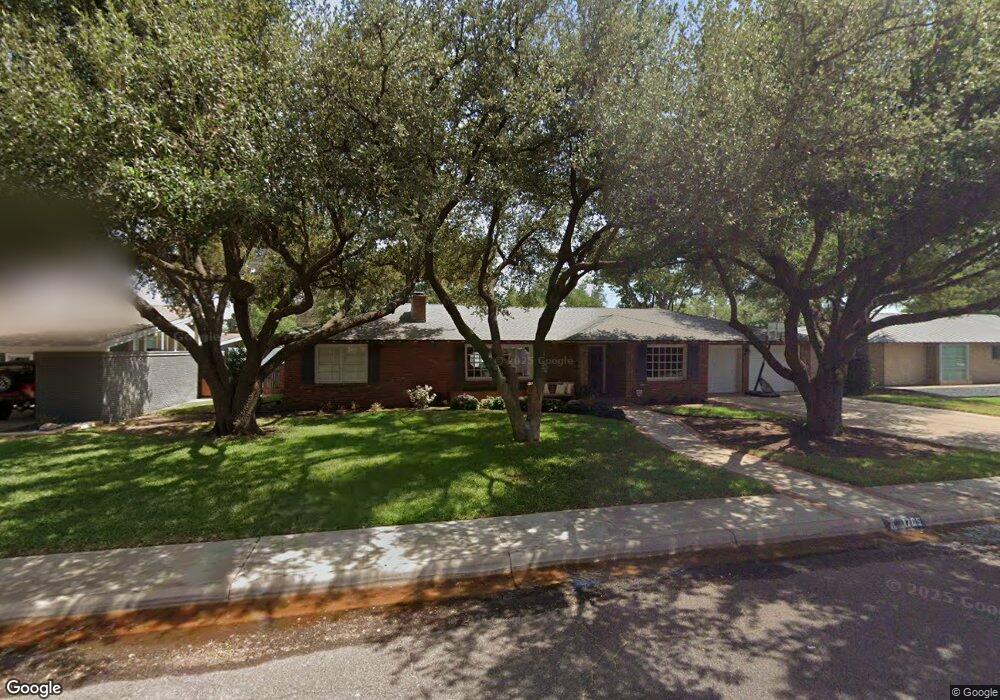
1705 Douglas Ave Midland, TX 79701
Estimated Value: $711,697 - $925,000
--
Bed
--
Bath
3,413
Sq Ft
$232/Sq Ft
Est. Value
About This Home
This home is located at 1705 Douglas Ave, Midland, TX 79701 and is currently estimated at $792,924, approximately $232 per square foot. 1705 Douglas Ave is a home located in Midland County with nearby schools including Midland High School, Sam Houston Collegiate Preparatory Elementary School, and First Baptist Child Development Center.
Ownership History
Date
Name
Owned For
Owner Type
Purchase Details
Closed on
Nov 16, 2016
Sold by
Hyde Matthew G and Hyde Catherine S
Bought by
Levea Brian and Hudson Rachel E
Current Estimated Value
Purchase Details
Closed on
Sep 2, 2008
Sold by
Hyde Bridget Houston
Bought by
Hyde Matthew Glover
Purchase Details
Closed on
Jul 24, 2007
Sold by
Hyde Matthew G
Bought by
Levea Brian
Home Financials for this Owner
Home Financials are based on the most recent Mortgage that was taken out on this home.
Original Mortgage
$238,000
Interest Rate
6.19%
Mortgage Type
Purchase Money Mortgage
Purchase Details
Closed on
Jun 28, 2007
Sold by
Ruwwe Mary A
Bought by
Hyde Matthew G
Home Financials for this Owner
Home Financials are based on the most recent Mortgage that was taken out on this home.
Original Mortgage
$238,000
Interest Rate
6.19%
Mortgage Type
Purchase Money Mortgage
Purchase Details
Closed on
Jul 12, 1957
Bought by
Levea Brian
Create a Home Valuation Report for This Property
The Home Valuation Report is an in-depth analysis detailing your home's value as well as a comparison with similar homes in the area
Home Values in the Area
Average Home Value in this Area
Purchase History
| Date | Buyer | Sale Price | Title Company |
|---|---|---|---|
| Levea Brian | -- | None Available | |
| Hyde Matthew Glover | -- | None Available | |
| Levea Brian | -- | -- | |
| Hyde Matthew G | -- | None Available | |
| Levea Brian | -- | -- |
Source: Public Records
Mortgage History
| Date | Status | Borrower | Loan Amount |
|---|---|---|---|
| Previous Owner | Hyde Matthew G | $238,000 |
Source: Public Records
Tax History Compared to Growth
Tax History
| Year | Tax Paid | Tax Assessment Tax Assessment Total Assessment is a certain percentage of the fair market value that is determined by local assessors to be the total taxable value of land and additions on the property. | Land | Improvement |
|---|---|---|---|---|
| 2025 | $6,394 | $528,530 | $36,280 | $492,250 |
| 2024 | $6,404 | $510,290 | $36,280 | $474,010 |
| 2023 | $7,414 | $494,750 | $36,280 | $458,470 |
| 2022 | $8,184 | $523,820 | $36,280 | $487,540 |
| 2021 | $8,502 | $488,000 | $36,280 | $451,720 |
| 2020 | $7,278 | $471,000 | $36,280 | $434,720 |
| 2019 | $8,917 | $471,000 | $36,280 | $434,720 |
| 2018 | $9,158 | $471,000 | $36,280 | $434,720 |
| 2017 | $11,054 | $568,500 | $36,280 | $532,220 |
| 2016 | $7,061 | $362,500 | $36,280 | $336,980 |
| 2015 | -- | $329,540 | $36,280 | $336,980 |
| 2014 | -- | $331,270 | $36,280 | $294,990 |
Source: Public Records
Map
Nearby Homes
- 1605 N I St
- 2003 Community Ln
- 1608 N L St
- 2011 Community Ln
- 2008 Harvard Ave
- 5709 E County Road 94
- 1509 Bedford Dr
- 1602 Country Club Dr
- 1501 Bedford Dr
- 6716 S County Road 1160 Unit A
- 1604 N N St
- 2008 Bedford Dr
- 2203 Princeton Ave
- 2009 Bedford Dr
- 1607 Shell Ave
- 1605 Shell Ave
- 2001 Country Club Dr
- 1606 Shell Ave
- 1212 Country Club Dr
- 2208 Bedford Dr
- 1703 Douglas Ave
- 1709 Douglas Ave
- 1706 Princeton Ave
- 1702 Princeton Ave
- 1701 Douglas Ave
- 1708 Princeton Ave
- 1704 Douglas Ave
- 1711 Douglas Ave
- 1708 Douglas Ave
- 1702 Douglas Ave
- 1710 Princeton Ave
- 1700 Princeton Ave
- 1710 Douglas Ave
- 1700 Douglas Ave
- 1713 Douglas Ave
- 1712 Princeton Ave
- 1712 Douglas Ave
- 1705 Princeton Ave
- 1707 Community Ln
- 1515 Douglas Ave