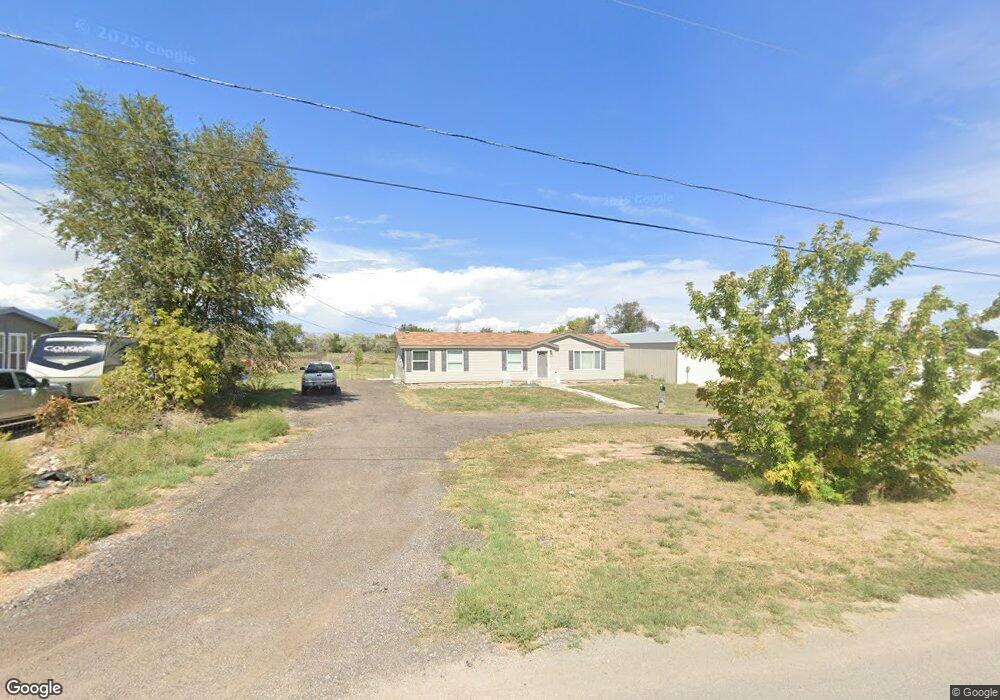
1705 E 4000 S Vernal, UT 84078
Estimated Value: $307,000 - $378,000
3
Beds
2
Baths
1,494
Sq Ft
$233/Sq Ft
Est. Value
About This Home
This home is located at 1705 E 4000 S, Vernal, UT 84078 and is currently estimated at $348,009, approximately $232 per square foot. 1705 E 4000 S is a home located in Uintah County with nearby schools including Davis School, Vernal Middle School, and Uintah Middle School.
Ownership History
Date
Name
Owned For
Owner Type
Purchase Details
Closed on
Aug 24, 2023
Sold by
Wilcock Eric
Bought by
Owens Jaxon and Smuin Kylie Nichole
Current Estimated Value
Home Financials for this Owner
Home Financials are based on the most recent Mortgage that was taken out on this home.
Original Mortgage
$13,770
Outstanding Balance
$13,465
Interest Rate
6.96%
Estimated Equity
$334,544
Purchase Details
Closed on
Jan 14, 2015
Sold by
Carrington Mortgage Svcs
Bought by
Usa Hud
Purchase Details
Closed on
Dec 6, 2006
Sold by
Rowley Marnell J
Bought by
Nielson John B and Nielson Angel L
Create a Home Valuation Report for This Property
The Home Valuation Report is an in-depth analysis detailing your home's value as well as a comparison with similar homes in the area
Home Values in the Area
Average Home Value in this Area
Purchase History
| Date | Buyer | Sale Price | Title Company |
|---|---|---|---|
| Owens Jaxon | -- | Truly Title | |
| Usa Hud | -- | -- | |
| Nielson John B | -- | -- |
Source: Public Records
Mortgage History
| Date | Status | Borrower | Loan Amount |
|---|---|---|---|
| Open | Owens Jaxon | $13,770 | |
| Open | Owens Jaxon | $313,222 |
Source: Public Records
Tax History Compared to Growth
Tax History
| Year | Tax Paid | Tax Assessment Tax Assessment Total Assessment is a certain percentage of the fair market value that is determined by local assessors to be the total taxable value of land and additions on the property. | Land | Improvement |
|---|---|---|---|---|
| 2024 | $1,422 | $169,205 | $25,800 | $143,405 |
| 2023 | $1,422 | $124,700 | $25,800 | $98,900 |
| 2022 | $1,017 | $98,520 | $25,800 | $72,720 |
| 2021 | $1,099 | $87,428 | $25,800 | $61,628 |
| 2020 | $979 | $79,979 | $22,000 | $57,979 |
| 2019 | $991 | $79,979 | $22,000 | $57,979 |
| 2018 | $955 | $77,218 | $22,000 | $55,218 |
| 2017 | $9 | $77,218 | $22,000 | $55,218 |
| 2016 | $989 | $87,736 | $22,000 | $65,736 |
| 2015 | $894 | $86,132 | $22,000 | $64,132 |
| 2014 | $884 | $86,132 | $22,000 | $64,132 |
| 2013 | $903 | $86,132 | $22,000 | $64,132 |
Source: Public Records
Map
Nearby Homes