

1705 Gaylord St Unit 207 Denver, CO 80206
City Park West NeighborhoodEstimated payment $3,117/month
Highlights
- Primary Bedroom Suite
- Gated Community
- Open Floorplan
- East High School Rated A
- City View
- Deck
About This Home
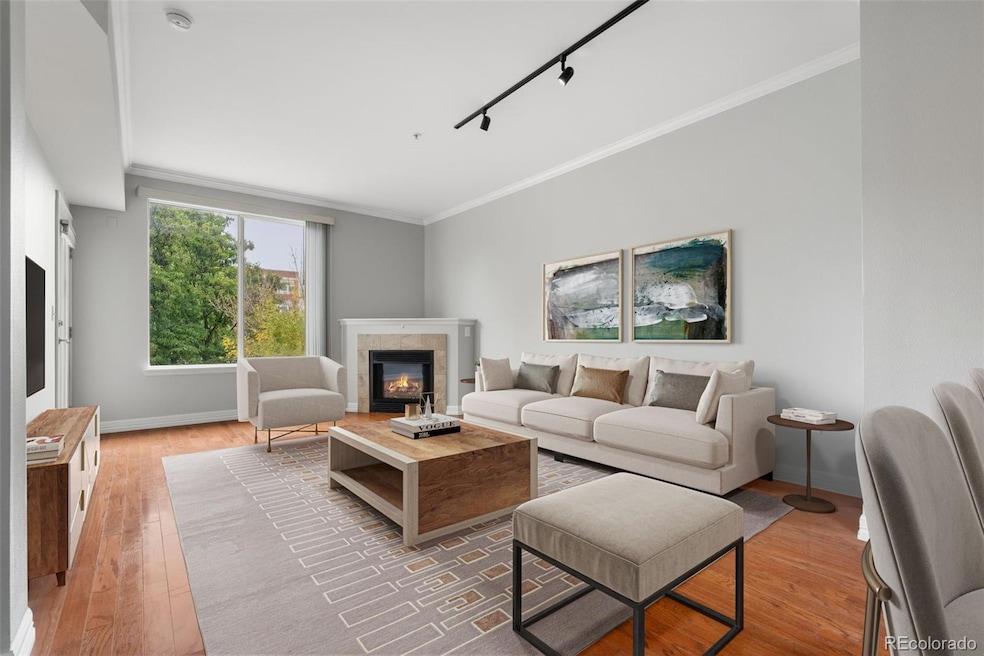
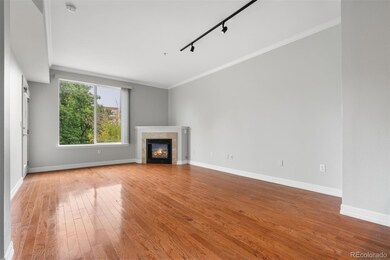
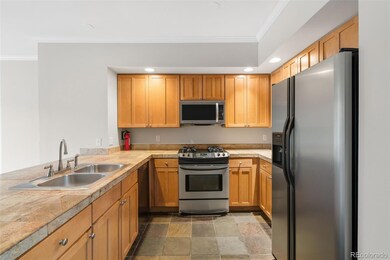
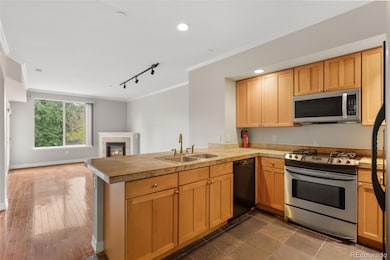
Extraordinary value in City Park West. Experience the best of Denver living in this stylish, updated two-bedroom, two (full) bath condo closet to great restaurants, shops and City Park! Inside, you’ll find a sun-drenched east-facing unit featuring high ceilings, fresh paint, newer carpet, and a thoughtfully designed layout. The kitchen boasts granite tile countertops, stainless steel appliances, dine in bar seating and tons of cabinet space/pantry. The spacious primary suite includes private balcony access, a walk-in closet with custom organizer, and a luxurious five-piece bath with a soaking tub. A second bedroom and full bath are perfectly positioned for guests or a home office. Enjoy modern conveniences like in-unit laundry with a newer washer and dryer, a new water heater, and a cozy gas fireplace in the open-concept living area. Step out onto the large, covered balcony from both the living room and primary bedroom—ideal for morning coffee or evening relaxation. The unit has also been a very reliable rental for many years! The secure, well-maintained building offers a reserved covered parking space, private storage closet, elevator access, and controlled entry. Just steps from City Park, the Denver Zoo, the Botanic Gardens, and a variety of shops, restaurants, and the brand-new recreation center, this location blends vibrant city life with the charm of a quieter, residential neighborhood.With proximity to Downtown, top medical centers, Cherry Creek, and excellent schools, this condo has it all.
Listing Agent
West and Main Homes Inc Brokerage Email: doug@WestAndMainHomes.com,720-301-4293 License #100069337 Listed on: 10/16/2025

Property Details
Home Type
- Condominium
Est. Annual Taxes
- $2,396
Year Built
- Built in 2003 | Remodeled
Lot Details
- 1 Common Wall
- East Facing Home
HOA Fees
- $461 Monthly HOA Fees
Parking
- Subterranean Parking
- Heated Garage
- Lighted Parking
Home Design
- Contemporary Architecture
- Entry on the 2nd floor
- Membrane Roofing
- Fiberglass Roof
- Concrete Block And Stucco Construction
- Concrete Perimeter Foundation
Interior Spaces
- 1,074 Sq Ft Home
- 3-Story Property
- Open Floorplan
- High Ceiling
- Ceiling Fan
- Gas Fireplace
- Double Pane Windows
- Window Treatments
- Living Room with Fireplace
- City Views
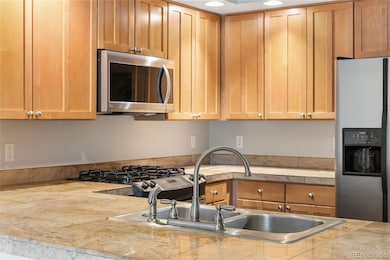
Kitchen
- Oven
- Range
- Microwave
- Dishwasher
- Kitchen Island
- Granite Countertops
- Disposal
Flooring
- Wood
- Carpet
- Stone
- Tile
Bedrooms and Bathrooms
- 2 Main Level Bedrooms
- Primary Bedroom Suite
- Walk-In Closet
- 2 Full Bathrooms
Laundry
- Laundry Room
- Dryer
- Washer
Home Security
Eco-Friendly Details
- Energy-Efficient Thermostat
- Smoke Free Home
Outdoor Features
- Balcony
- Deck
- Covered Patio or Porch
Schools
- Cole Arts And Science Academy Elementary School
- Mcauliffe International Middle School
- East High School
Utilities
- Forced Air Heating and Cooling System
- Heating System Uses Natural Gas
- 110 Volts
- Natural Gas Connected
- Gas Water Heater
Listing and Financial Details
- Exclusions: Seller's personal property and stating item.
- Assessor Parcel Number 2355-15-044
Community Details
Overview
- Association fees include insurance, ground maintenance, maintenance structure, recycling, sewer, trash, water
- Service Plus Community Managment Association, Phone Number (720) 571-1440
- Low-Rise Condominium
- Marais Community
- Uptown Subdivision
- Community Parking
Amenities
- Elevator
- Community Storage Space
Pet Policy
- Dogs and Cats Allowed
Security
- Controlled Access
- Gated Community
- Fire and Smoke Detector
Map
Home Values in the Area
Average Home Value in this Area
Tax History
| Year | Tax Paid | Tax Assessment Tax Assessment Total Assessment is a certain percentage of the fair market value that is determined by local assessors to be the total taxable value of land and additions on the property. | Land | Improvement |
|---|---|---|---|---|
| 2024 | $2,396 | $30,250 | $450 | $29,800 |
| 2023 | $2,344 | $30,250 | $450 | $29,800 |
| 2022 | $2,332 | $29,330 | $5,150 | $24,180 |
| 2021 | $2,251 | $30,170 | $5,300 | $24,870 |
| 2020 | $2,336 | $31,480 | $3,530 | $27,950 |
| 2019 | $2,270 | $31,480 | $3,530 | $27,950 |
| 2018 | $2,192 | $28,330 | $2,440 | $25,890 |
| 2017 | $2,185 | $28,330 | $2,440 | $25,890 |
| 2016 | $1,894 | $23,220 | $2,086 | $21,134 |
| 2015 | $1,814 | $23,220 | $2,086 | $21,134 |
| 2014 | $1,264 | $15,220 | $2,332 | $12,888 |
Property History
| Date | Event | Price | List to Sale | Price per Sq Ft |
|---|---|---|---|---|
| 11/16/2025 11/16/25 | Price Changed | $465,000 | -5.1% | $433 / Sq Ft |
| 10/16/2025 10/16/25 | For Sale | $490,000 | -- | $456 / Sq Ft |
Purchase History
| Date | Type | Sale Price | Title Company |
|---|---|---|---|
| Interfamily Deed Transfer | -- | Title365 | |
| Warranty Deed | $349,000 | Chicago Title | |
| Special Warranty Deed | $278,000 | Fahtco |
Mortgage History
| Date | Status | Loan Amount | Loan Type |
|---|---|---|---|
| Open | $279,200 | New Conventional | |
| Previous Owner | $222,400 | Fannie Mae Freddie Mac | |
| Closed | $55,600 | No Value Available | |
| Closed | $0 | New Conventional |
Source: REcolorado®
MLS Number: 3353826
APN: 2355-15-044
Disclaimer: Certain information contained herein is derived from information provided by parties other than Homes.com. All information provided is deemed reliable, but is not guaranteed to be accurate and should be independently verified.
![]() The content relating to real estate for sale in this Web site comes in part from the Internet Data eXchange (“IDX”) program of METROLIST, INC., DBA RECOLORADO®. Real estate listings held by brokers other than Ten-X are marked with the IDX Logo. This information is being provided for the consumers’ personal, non-commercial use and may not be used for any other purpose. All information subject to change and should be independently verified.
The content relating to real estate for sale in this Web site comes in part from the Internet Data eXchange (“IDX”) program of METROLIST, INC., DBA RECOLORADO®. Real estate listings held by brokers other than Ten-X are marked with the IDX Logo. This information is being provided for the consumers’ personal, non-commercial use and may not be used for any other purpose. All information subject to change and should be independently verified.
This publication is designed to provide information with regard to the subject matter covered. It is displayed with the understanding that the publisher and authors are not engaged in rendering real estate, legal, accounting, tax, or other professional services and that the publisher and authors are not offering such advice in this publication. If real estate, legal, or other expert assistance is required, the services of a competent, professional person should be sought.
The information contained in this publication is subject to change without notice. METROLIST, INC., DBA RECOLORADO MAKES NO WARRANTY OF ANY KIND WITH REGARD TO THIS MATERIAL, INCLUDING, BUT NOT LIMITED TO, THE IMPLIED WARRANTIES OF MERCHANTABILITY AND FITNESS FOR A PARTICULAR PURPOSE. METROLIST, INC., DBA RECOLORADO SHALL NOT BE LIABLE FOR ERRORS CONTAINED HEREIN OR FOR ANY DAMAGES IN CONNECTION WITH THE FURNISHING, PERFORMANCE, OR USE OF THIS MATERIAL.
PUBLISHER’S NOTICE: All real estate advertised herein is subject to the Federal Fair Housing Act and the Colorado Fair Housing Act, which Acts make it illegal to make or publish any advertisement that indicates any preference, limitation, or discrimination based on race, color, religion, sex, handicap, familial status, or national origin.
METROLIST, INC., DBA RECOLORADO will not knowingly accept any advertising for real estate that is in violation of the law. All persons are hereby informed that all dwellings advertised are available on an equal opportunity basis.
© 2025 METROLIST, INC., DBA RECOLORADO® – All Rights Reserved. 6455 S. Yosemite St., Suite 500 Greenwood Village, CO 80111 USA
ALL RIGHTS RESERVED WORLDWIDE. No part of this publication may be reproduced, adapted, translated, stored in a retrieval system or transmitted in any form or by any means, electronic, mechanical, photocopying, recording, or otherwise, without the prior written permission of the publisher. The information contained herein including but not limited to all text, photographs, digital images, virtual tours, may be seeded and monitored for protection and tracking.
- 1705 Gaylord St Unit 108
- 1735 Gaylord St
- 1718 N Gaylord St
- 1750 Gaylord St Unit A
- 1750 Gaylord St Unit H
- 1633 Gaylord St
- 1632 York St
- 1860 Race St
- 1721 High St
- 1521 Vine St Unit 107
- 1521 Vine St Unit 108
- 1521 Vine St Unit 302
- 1569 N High St
- 2023 E 20th Ave
- 1815 N Williams St
- 1471 Josephine St
- 1833 N Williams St Unit 206
- 1833 N Williams St Unit 101
- 1833 N Williams St Unit 307
- 1833 N Williams St Unit 306
- 1705 Gaylord St Unit 205
- 2124 E 17th Ave Unit 5
- 1660 N Gaylord St Unit ID1026266P
- 1660 N Gaylord St Unit ID1026278P
- 1781 York St
- 1621 York St Unit 1
- 1575 N Gaylord St Unit 8
- 1575 N Gaylord St Unit 7
- 1568 Vine St Unit 3
- 1833 N Williams St Unit 504
- 1833 N Williams St Unit 401
- 1833 N Williams St Unit 303
- 1614 N Gilpin St
- 1450 High St
- 1410 York St
- 1405 Race St
- 1666 Detroit St Unit ID1243907P
- 1666 Detroit St Unit ID1026254P
- 1666 Detroit St Unit ID1026255P
- 1666 Detroit St Unit ID1026272P