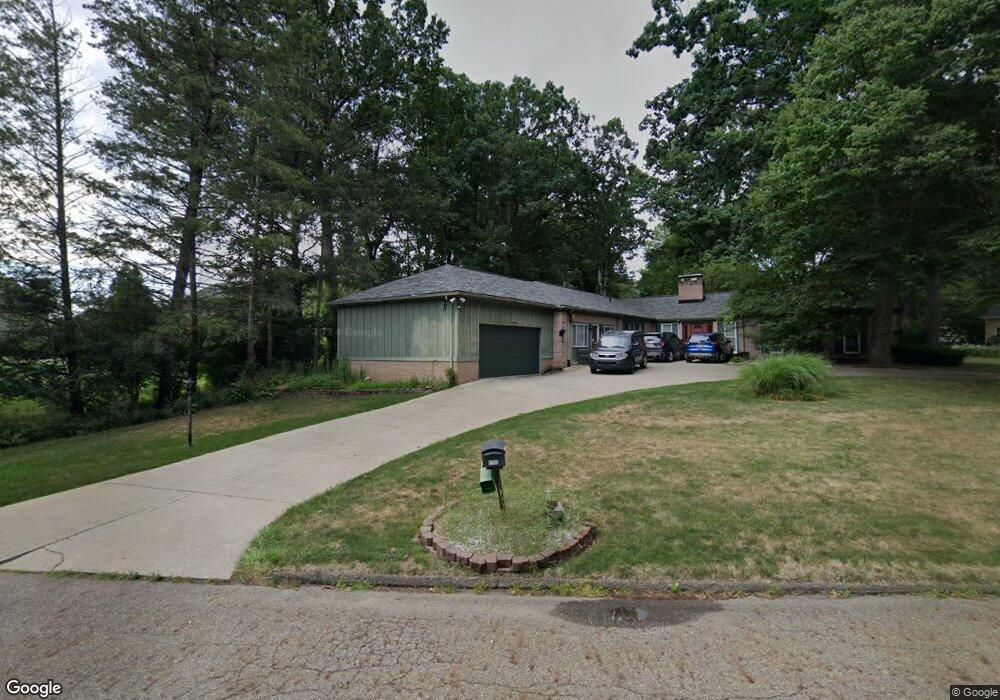
1705 Markley St NW North Canton, OH 44720
Estimated Value: $370,000 - $470,000
3
Beds
3
Baths
3,582
Sq Ft
$119/Sq Ft
Est. Value
About This Home
This home is located at 1705 Markley St NW, North Canton, OH 44720 and is currently estimated at $424,704, approximately $118 per square foot. 1705 Markley St NW is a home located in Stark County with nearby schools including Middlebranch Elementary School, Oakwood Middle School, and GlenOak High School.
Ownership History
Date
Name
Owned For
Owner Type
Purchase Details
Closed on
Apr 18, 2016
Sold by
Bookwalter Robert D and Bookwalter Carolyn J
Bought by
Bookwalter Jeffrey R and Bookwalter Svetlana
Current Estimated Value
Home Financials for this Owner
Home Financials are based on the most recent Mortgage that was taken out on this home.
Original Mortgage
$114,428
Outstanding Balance
$90,787
Interest Rate
3.64%
Mortgage Type
FHA
Estimated Equity
$333,917
Purchase Details
Closed on
Feb 1, 2003
Sold by
Bookwalter Robert D and Bookwalter Carolyn J
Bought by
Bookwalter Robert D and Bookwalter Carolyn J
Purchase Details
Closed on
Aug 11, 2000
Sold by
Helgesen Mary L
Bought by
Bookwalter Robert D and Bookwalter Carolyn J
Home Financials for this Owner
Home Financials are based on the most recent Mortgage that was taken out on this home.
Original Mortgage
$140,000
Interest Rate
8.16%
Mortgage Type
Purchase Money Mortgage
Purchase Details
Closed on
Feb 7, 1992
Create a Home Valuation Report for This Property
The Home Valuation Report is an in-depth analysis detailing your home's value as well as a comparison with similar homes in the area
Purchase History
| Date | Buyer | Sale Price | Title Company |
|---|---|---|---|
| Bookwalter Jeffrey R | $125,000 | None Available | |
| Bookwalter Robert D | -- | -- | |
| Bookwalter Robert D | $175,000 | -- | |
| -- | -- | -- |
Source: Public Records
Mortgage History
| Date | Status | Borrower | Loan Amount |
|---|---|---|---|
| Open | Bookwalter Jeffrey R | $114,428 | |
| Previous Owner | Bookwalter Robert D | $140,000 |
Source: Public Records
Tax History
| Year | Tax Paid | Tax Assessment Tax Assessment Total Assessment is a certain percentage of the fair market value that is determined by local assessors to be the total taxable value of land and additions on the property. | Land | Improvement |
|---|---|---|---|---|
| 2025 | -- | $157,120 | $37,980 | $119,140 |
| 2024 | -- | $157,120 | $37,980 | $119,140 |
| 2023 | $5,355 | $114,980 | $25,240 | $89,740 |
| 2022 | $5,377 | $114,980 | $25,240 | $89,740 |
| 2021 | $5,401 | $114,980 | $25,240 | $89,740 |
| 2020 | $4,872 | $94,400 | $21,770 | $72,630 |
| 2019 | $4,831 | $94,400 | $21,770 | $72,630 |
Source: Public Records
Map
Nearby Homes
- 1208 Marquardt Ave NW
- 1224 Marquardt Ave NW
- 1216 Marquardt Ave NW
- 0 Marquardt Dr NW
- 7041 Market Ave N
- 2041 Penhurst Cir NE
- 0 Marquardt Ave
- 1124 Laurel Green Dr NE
- 407 Eastbury Ave NE
- 1240 Fountain View St NE
- 800 Weber Ave NE
- 605 Briar Ave NE
- 6811 Harrington Court Ave NE
- 1068 Ivy St NW
- 1443 Southbrook Cir NE
- 945 Royal Oak Ave NE
- 2380 Orchid St NW
- 2033 Red Coach Rd NW
- 7416 Woodcrest Ave NE
- 1524 Eagle Watch St NE
- 1723 Markley St NW
- 1685 Markley St NW
- 1710 Markley St NW
- 1702 Markley St NW
- 1720 Markley St NW
- 1029 Briarview Ave NW
- 1671 Markley St NW
- 955 Briarview Ave NW
- 955 Briarview Ave NW
- 1022 Briarview Ave NW
- 1010 Briarview Ave NW
- 1037 Briarview Ave NW
- 945 Briarview Ave NW
- 1580 Steiner St NW
- 1684 Markley St NW
- 1840 Markley St NW
- 1036 Briarview Ave NW
- 1560 Steiner St NW
- 960 Briarview Ave NW
- 935 Briarview Ave NW
Your Personal Tour Guide
Ask me questions while you tour the home.