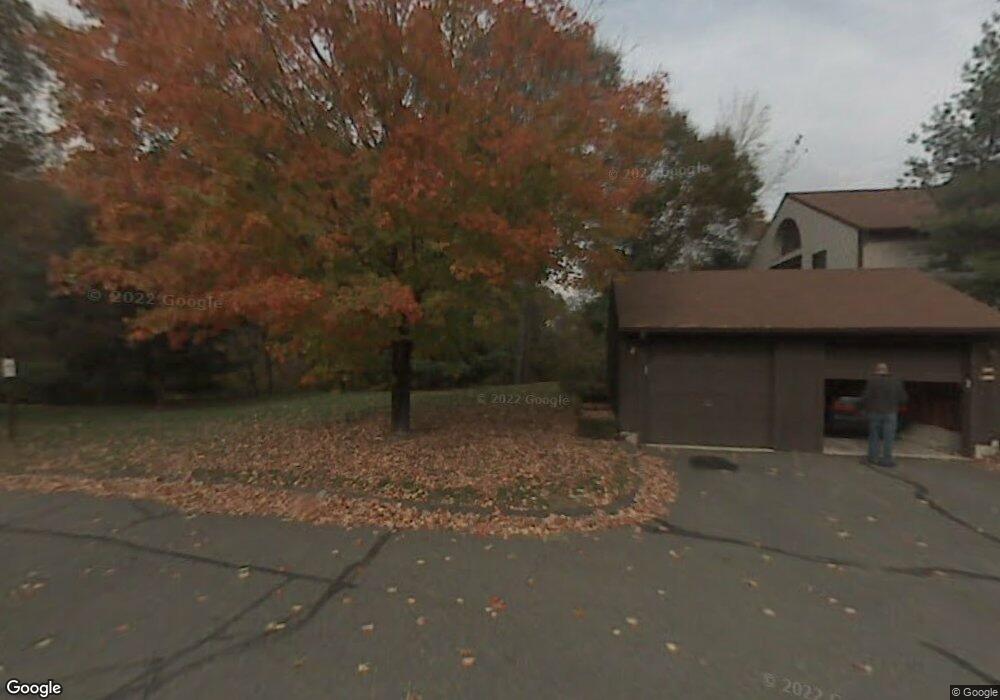
1705 Mill Pond Dr South Windsor, CT 06074
Estimated Value: $335,000 - $383,352
2
Beds
2
Baths
1,300
Sq Ft
$275/Sq Ft
Est. Value
About This Home
This home is located at 1705 Mill Pond Dr, South Windsor, CT 06074 and is currently estimated at $357,588, approximately $275 per square foot. 1705 Mill Pond Dr is a home located in Hartford County with nearby schools including Timothy Edwards School, South Windsor High School, and East Catholic High School.
Ownership History
Date
Name
Owned For
Owner Type
Purchase Details
Closed on
Jul 24, 2015
Sold by
Thibodeau Stephan A
Bought by
Park Hyun J
Current Estimated Value
Purchase Details
Closed on
Jul 15, 2011
Sold by
Palmer Natalie
Bought by
Thibodeau Stephan A
Home Financials for this Owner
Home Financials are based on the most recent Mortgage that was taken out on this home.
Original Mortgage
$157,405
Interest Rate
4.25%
Mortgage Type
FHA
Purchase Details
Closed on
Oct 15, 2001
Sold by
Judd Lorraine
Bought by
Palmer Natalie
Home Financials for this Owner
Home Financials are based on the most recent Mortgage that was taken out on this home.
Original Mortgage
$118,400
Interest Rate
6.93%
Purchase Details
Closed on
Apr 7, 1995
Sold by
Sicord Patricia
Bought by
Judd Lorraine
Home Financials for this Owner
Home Financials are based on the most recent Mortgage that was taken out on this home.
Original Mortgage
$81,000
Interest Rate
8.66%
Mortgage Type
Unknown
Create a Home Valuation Report for This Property
The Home Valuation Report is an in-depth analysis detailing your home's value as well as a comparison with similar homes in the area
Home Values in the Area
Average Home Value in this Area
Purchase History
| Date | Buyer | Sale Price | Title Company |
|---|---|---|---|
| Park Hyun J | $150,000 | -- | |
| Thibodeau Stephan A | $161,500 | -- | |
| Palmer Natalie | $148,000 | -- | |
| Judd Lorraine | $101,000 | -- |
Source: Public Records
Mortgage History
| Date | Status | Borrower | Loan Amount |
|---|---|---|---|
| Previous Owner | Thibodeau Stephan A | $157,405 | |
| Previous Owner | Judd Lorraine | $118,400 | |
| Previous Owner | Judd Lorraine | $81,000 | |
| Previous Owner | Judd Lorraine | $85,000 |
Source: Public Records
Tax History Compared to Growth
Tax History
| Year | Tax Paid | Tax Assessment Tax Assessment Total Assessment is a certain percentage of the fair market value that is determined by local assessors to be the total taxable value of land and additions on the property. | Land | Improvement |
|---|---|---|---|---|
| 2024 | $6,230 | $180,800 | $0 | $180,800 |
| 2023 | $5,992 | $180,800 | $0 | $180,800 |
| 2022 | $4,032 | $104,000 | $0 | $104,000 |
| 2021 | $3,937 | $104,000 | $0 | $104,000 |
| 2020 | $3,940 | $104,000 | $0 | $104,000 |
| 2019 | $4,004 | $104,000 | $0 | $104,000 |
| 2018 | $3,918 | $104,000 | $0 | $104,000 |
| 2017 | $4,177 | $109,700 | $0 | $109,700 |
| 2016 | $4,096 | $109,700 | $0 | $109,700 |
| 2015 | $4,008 | $109,700 | $0 | $109,700 |
| 2014 | -- | $109,700 | $0 | $109,700 |
Source: Public Records
Map
Nearby Homes
- 710 Twin Circle Dr Unit 710
- 24 Podunk Cir Unit 24
- 80 Candlewood Dr Unit 80
- 87 Swan Nest
- 96 Candlewood Dr Unit 96
- 41 Candlewood Dr Unit 41
- 17 Arrowwood Cir
- 25 Stonehaven Cir
- 75 Sharon Dr
- 962 Pleasant Valley Rd
- 913 Pleasant Valley Rd
- 949 Pleasant Valley Rd
- 204 Kebalo Ln
- 50 Parkview Dr
- 7 Cinnamon Springs Unit 7
- 257 Pepin Place Unit 257
- 25 Amato Dr Unit H
- 438 Pleasant Valley Rd
- 260 Smith St
- 263 Lefoll Blvd
- 1705 Mill Pond Dr Unit 1705
- 1704 Mill Pond Dr
- 1704 Mill Pond Dr Unit 1704
- 1706 Mill Pond Dr
- 1706 Mill Pond Dr Unit 1706
- 1703 Mill Pond Dr
- 1703 Mill Pond Dr Unit 1703
- 1707 Mill Pond Dr
- 1702 Mill Pond Dr
- 1702 Mill Pond Dr Unit 1702
- 1709 Mill Pond Dr
- 1708 Mill Pond Dr
- 1701 Mill Pond Dr
- 1804 Mill Pond Dr
- 1804 Mill Pond Dr Unit 1804
- 1810 Mill Pond Dr
- 1802 Mill Pond Dr
- 1806 Mill Pond Dr
- 1803 Mill Pond Dr
- 1807 Mill Pond Dr