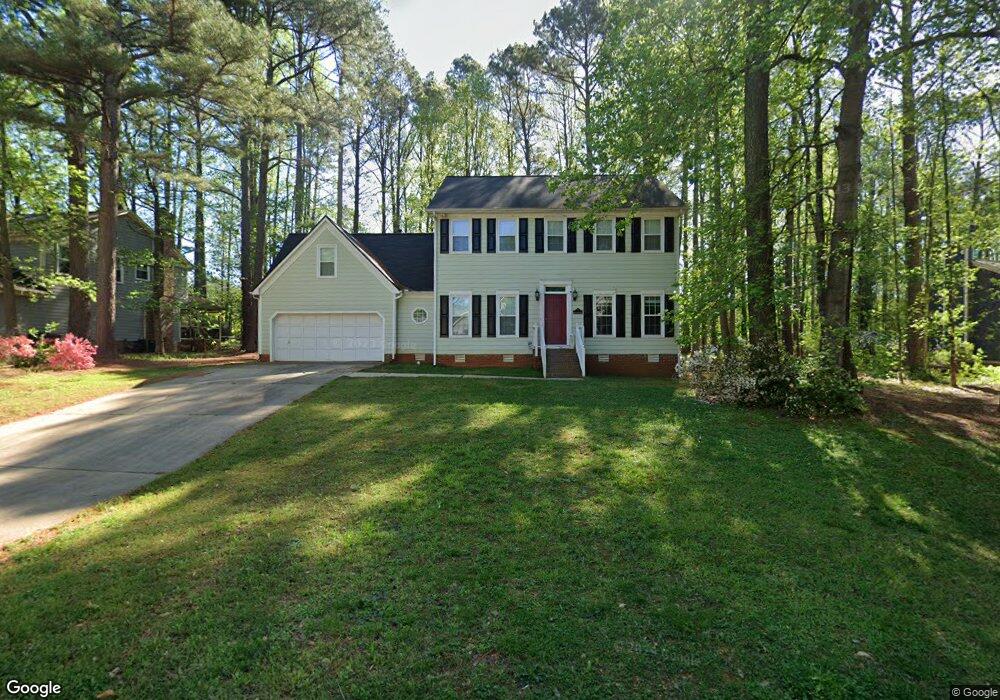
1705 Misty Meadow Ln Garner, NC 27529
Estimated Value: $413,000 - $461,000
3
Beds
4
Baths
2,443
Sq Ft
$175/Sq Ft
Est. Value
About This Home
This home is located at 1705 Misty Meadow Ln, Garner, NC 27529 and is currently estimated at $428,471, approximately $175 per square foot. 1705 Misty Meadow Ln is a home located in Wake County with nearby schools including Vandora Springs Elementary, North Garner Middle, and Garner High.
Ownership History
Date
Name
Owned For
Owner Type
Purchase Details
Closed on
Mar 9, 2015
Sold by
Robbins Nathan C and Robbins Susan R
Bought by
Boyette Jason L and Boyette Alex
Current Estimated Value
Home Financials for this Owner
Home Financials are based on the most recent Mortgage that was taken out on this home.
Original Mortgage
$207,100
Outstanding Balance
$158,968
Interest Rate
3.74%
Mortgage Type
New Conventional
Estimated Equity
$269,503
Purchase Details
Closed on
Jan 19, 2010
Sold by
Federal Home Loan Mortgage Corporation
Bought by
Robbins Nathan C and Robbins Susan B
Home Financials for this Owner
Home Financials are based on the most recent Mortgage that was taken out on this home.
Original Mortgage
$152,192
Interest Rate
4.97%
Mortgage Type
FHA
Purchase Details
Closed on
Aug 14, 2009
Sold by
Upchurch Lou Ann and Upchurch Timothy W
Bought by
Federal Home Loan Mortgage Corporation
Purchase Details
Closed on
May 22, 1995
Bought by
Boyette Jason L and Boyette Alex
Create a Home Valuation Report for This Property
The Home Valuation Report is an in-depth analysis detailing your home's value as well as a comparison with similar homes in the area
Home Values in the Area
Average Home Value in this Area
Purchase History
| Date | Buyer | Sale Price | Title Company |
|---|---|---|---|
| Boyette Jason L | $218,000 | None Available | |
| Robbins Nathan C | -- | Stronghold Land Title Corp | |
| Federal Home Loan Mortgage Corporation | $189,588 | None Available | |
| Boyette Jason L | $140,000 | -- |
Source: Public Records
Mortgage History
| Date | Status | Borrower | Loan Amount |
|---|---|---|---|
| Open | Boyette Jason L | $207,100 | |
| Previous Owner | Robbins Nathan C | $152,192 |
Source: Public Records
Tax History Compared to Growth
Tax History
| Year | Tax Paid | Tax Assessment Tax Assessment Total Assessment is a certain percentage of the fair market value that is determined by local assessors to be the total taxable value of land and additions on the property. | Land | Improvement |
|---|---|---|---|---|
| 2025 | $3,692 | $354,024 | $85,000 | $269,024 |
| 2024 | $3,679 | $354,024 | $85,000 | $269,024 |
| 2023 | $3,476 | $269,184 | $53,000 | $216,184 |
| 2022 | $3,174 | $269,184 | $53,000 | $216,184 |
| 2021 | $3,014 | $269,184 | $53,000 | $216,184 |
| 2020 | $2,973 | $269,184 | $53,000 | $216,184 |
| 2019 | $2,840 | $220,171 | $48,000 | $172,171 |
| 2018 | $2,633 | $220,171 | $48,000 | $172,171 |
| 2017 | $2,546 | $220,171 | $48,000 | $172,171 |
| 2016 | $2,515 | $220,171 | $48,000 | $172,171 |
| 2015 | $2,217 | $194,084 | $44,000 | $150,084 |
| 2014 | $2,112 | $194,084 | $44,000 | $150,084 |
Source: Public Records
Map
Nearby Homes
- 1302 Buffaloe Rd
- 2205 Moon Water Way
- 721 Thompson Rd
- 715 Thompson Rd
- 725 Thompson Rd
- 106 Teak Cir
- 112 Lager Ln
- 100 Lager Ln
- 0 Old Stage Rd
- 111 Clayfield Dr
- 1424 Rollman Farm Rd
- 106 New Dawn Ct
- Nassau Cove End Unit Plan at Rollman Farms - Villas
- Nassau Cove Plan at Rollman Farms - Villas
- 1341 Rollman Farm Rd
- 1313 Rollman Farm Rd
- 1336 Rollman Farm Rd
- 1333 Rollman Farm Rd
- 1328 Rollman Farm Rd
- 1317 Rollman Farm Rd
- 1701 Misty Meadow Ln
- 1711 Misty Meadow Ln
- 1616 Edenderry Ct
- 2201 Shady Birch Ln
- 1617 Misty Meadow Ln
- 1715 Misty Meadow Ln
- 2200 Shady Birch Ln
- 1610 Edenderry Ct
- 1620 Edenderry Ct
- 2205 Shady Birch Ln
- 1712 Misty Meadow Ln
- 1604 Edenderry Ct
- 1719 Misty Meadow Ln
- 1611 Misty Meadow Ln
- 2204 Shady Birch Ln
- 1716 Misty Meadow Ln
- 1702 Lisburn Ct
- 2209 Shady Birch Ln
- 1621 Edenderry Ct
- 1721 Misty Meadow Ln