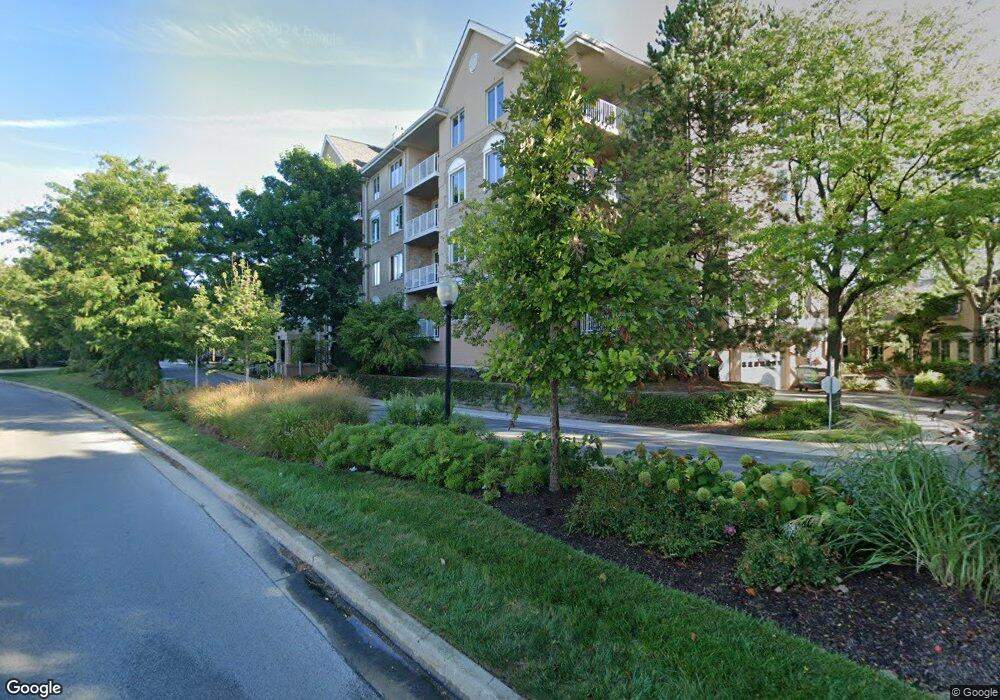
1705 Pavilion Way Unit 17055 Park Ridge, IL 60068
Estimated Value: $217,000 - $443,000
2
Beds
--
Bath
332,600
Sq Ft
$1/Sq Ft
Est. Value
About This Home
This home is located at 1705 Pavilion Way Unit 17055, Park Ridge, IL 60068 and is currently estimated at $330,278, approximately $0 per square foot. 1705 Pavilion Way Unit 17055 is a home located in Cook County with nearby schools including Franklin Elementary School, Emerson Middle School, and Maine East High School.
Ownership History
Date
Name
Owned For
Owner Type
Purchase Details
Closed on
Sep 21, 2010
Sold by
Cimo Valentino
Bought by
Livin Cimo Valentino and Valentino Cimo Revocable Living Trust
Current Estimated Value
Purchase Details
Closed on
Sep 7, 2006
Sold by
Dziewulski Heather M
Bought by
Cimo Valentino
Home Financials for this Owner
Home Financials are based on the most recent Mortgage that was taken out on this home.
Original Mortgage
$276,000
Outstanding Balance
$161,924
Interest Rate
6.25%
Mortgage Type
Unknown
Estimated Equity
$168,354
Purchase Details
Closed on
Nov 30, 2000
Sold by
Yoshioka Robert T and Yoshioka Carol R
Bought by
Peck Shirley J
Purchase Details
Closed on
Dec 10, 1997
Sold by
Cole Taylor Bank
Bought by
Yoshioka Robert T and Yoshioka Carol R
Home Financials for this Owner
Home Financials are based on the most recent Mortgage that was taken out on this home.
Original Mortgage
$80,000
Interest Rate
7.26%
Create a Home Valuation Report for This Property
The Home Valuation Report is an in-depth analysis detailing your home's value as well as a comparison with similar homes in the area
Home Values in the Area
Average Home Value in this Area
Purchase History
| Date | Buyer | Sale Price | Title Company |
|---|---|---|---|
| Livin Cimo Valentino | -- | None Available | |
| Cimo Valentino | $345,000 | Republic Title Company | |
| Cimo Valentino | $345,000 | Republic Title Company | |
| Peck Shirley J | $290,000 | -- | |
| Yoshioka Robert T | $224,000 | -- |
Source: Public Records
Mortgage History
| Date | Status | Borrower | Loan Amount |
|---|---|---|---|
| Open | Cimo Valentino | $276,000 | |
| Closed | Cimo Valentino | $276,000 | |
| Previous Owner | Yoshioka Robert T | $80,000 |
Source: Public Records
Tax History Compared to Growth
Tax History
| Year | Tax Paid | Tax Assessment Tax Assessment Total Assessment is a certain percentage of the fair market value that is determined by local assessors to be the total taxable value of land and additions on the property. | Land | Improvement |
|---|---|---|---|---|
| 2024 | $2,517 | $15,992 | $372 | $15,620 |
| 2023 | $2,358 | $15,992 | $372 | $15,620 |
| 2022 | $2,358 | $15,992 | $372 | $15,620 |
| 2021 | $609 | $8,659 | $242 | $8,417 |
| 2020 | $718 | $8,659 | $242 | $8,417 |
| 2019 | $733 | $9,668 | $242 | $9,426 |
| 2018 | $1,370 | $11,658 | $214 | $11,444 |
| 2017 | $1,398 | $11,658 | $214 | $11,444 |
| 2016 | $2,315 | $11,658 | $214 | $11,444 |
| 2015 | $1,880 | $11,357 | $185 | $11,172 |
| 2014 | $1,875 | $11,357 | $185 | $11,172 |
| 2013 | $1,841 | $11,701 | $185 | $11,516 |
Source: Public Records
Map
Nearby Homes
- 1705 Pavilion Way Unit 303
- 1715 Pavilion Way Unit 205
- 1735 Park Ridge Point
- 1745 Pavilion Way Unit 502
- 1010 Crabtree Ln
- 980 Apple Creek Ln
- 2448 Seminary Ave
- 2015 Busse Hwy
- 1316 N Northwest Hwy
- 1241 Elliott St
- 9395 Landings Ln Unit 401
- 9395 Landings Ln Unit 302
- 9396 Landings Ln Unit 203
- 9396 Landings Ln Unit 207
- 9396 Landings Ln Unit 404
- 9396 Landings Ln Unit 506
- 9396 Landings Ln Unit 206
- 9396 Landings Ln Unit 602
- 9396 Landings Ln Unit 605
- 9356 Landings Ln Unit 505
- 1705 Pavilion Way Unit 408
- 1705 Pavilion Way Unit 17053
- 1705 Pavilion Way Unit 17053
- 1705 Pavilion Way Unit 17052
- 1705 Pavilion Way Unit 17052
- 1705 Pavilion Way Unit 17053
- 1705 Pavilion Way Unit 17055
- 1705 Pavilion Way Unit 17055
- 1705 Pavilion Way Unit 17055
- 1705 Pavilion Way Unit 17054
- 1705 Pavilion Way Unit 17054
- 1705 Pavilion Way Unit 17054
- 1705 Pavilion Way Unit 17055
- 1705 Pavilion Way Unit 17052
- 1705 Pavilion Way Unit 17053
- 1705 Pavilion Way Unit 17055
- 1705 Pavilion Way Unit 17052
- 1705 Pavilion Way Unit 17055
- 1705 Pavilion Way Unit 17054
- 1705 Pavilion Way Unit 17055