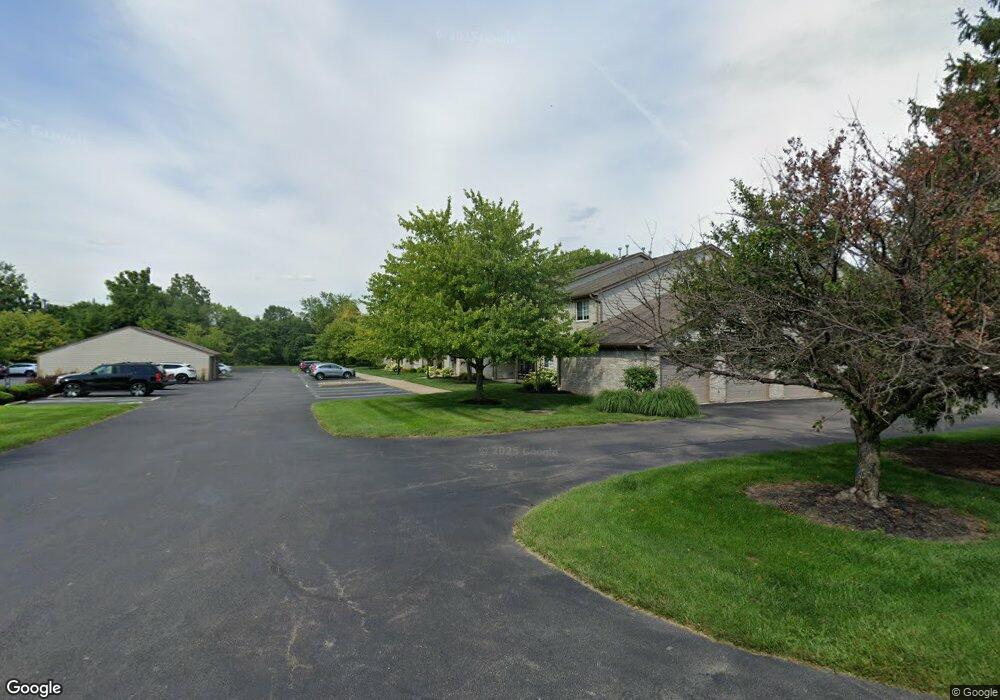
1705 Piper Ln Unit 1705206 Dayton, OH 45440
Estimated Value: $164,000 - $181,000
2
Beds
2
Baths
1,121
Sq Ft
$155/Sq Ft
Est. Value
About This Home
This home is located at 1705 Piper Ln Unit 1705206, Dayton, OH 45440 and is currently estimated at $173,502, approximately $154 per square foot. 1705 Piper Ln Unit 1705206 is a home located in Montgomery County with nearby schools including Primary Village North, Driscoll Elementary School, and Tower Heights Middle School.
Ownership History
Date
Name
Owned For
Owner Type
Purchase Details
Closed on
Aug 1, 2016
Sold by
Roach Edward J and Burns Naomi Jane
Bought by
Kakas Mark G and Kakas Gayle R
Current Estimated Value
Purchase Details
Closed on
Dec 29, 2003
Sold by
Januzzi Laura A
Bought by
Roach Edward J
Home Financials for this Owner
Home Financials are based on the most recent Mortgage that was taken out on this home.
Original Mortgage
$72,250
Interest Rate
5.84%
Mortgage Type
Purchase Money Mortgage
Purchase Details
Closed on
Aug 9, 2002
Sold by
Bennett Eric J and Bennett Cynthia J
Bought by
Januzzi Laura A
Home Financials for this Owner
Home Financials are based on the most recent Mortgage that was taken out on this home.
Original Mortgage
$67,450
Interest Rate
3.99%
Purchase Details
Closed on
Jun 16, 1998
Sold by
Hills Communities Inc
Bought by
Bennett Eric J and Bennett Cynthia J
Create a Home Valuation Report for This Property
The Home Valuation Report is an in-depth analysis detailing your home's value as well as a comparison with similar homes in the area
Home Values in the Area
Average Home Value in this Area
Purchase History
| Date | Buyer | Sale Price | Title Company |
|---|---|---|---|
| Kakas Mark G | $71,300 | None Available | |
| Roach Edward J | $85,000 | -- | |
| Januzzi Laura A | $75,500 | Landmark Title Agency Inc So | |
| Bennett Eric J | $83,200 | -- | |
| Bennett Eric J | $83,200 | -- |
Source: Public Records
Mortgage History
| Date | Status | Borrower | Loan Amount |
|---|---|---|---|
| Previous Owner | Roach Edward J | $72,250 | |
| Previous Owner | Januzzi Laura A | $67,450 |
Source: Public Records
Tax History Compared to Growth
Tax History
| Year | Tax Paid | Tax Assessment Tax Assessment Total Assessment is a certain percentage of the fair market value that is determined by local assessors to be the total taxable value of land and additions on the property. | Land | Improvement |
|---|---|---|---|---|
| 2024 | $2,447 | $41,930 | $8,290 | $33,640 |
| 2023 | $2,447 | $41,930 | $8,290 | $33,640 |
| 2022 | $2,236 | $30,360 | $6,010 | $24,350 |
| 2021 | $2,242 | $30,360 | $6,010 | $24,350 |
| 2020 | $2,239 | $30,360 | $6,010 | $24,350 |
| 2019 | $1,966 | $23,760 | $6,010 | $17,750 |
| 2018 | $1,744 | $23,760 | $6,010 | $17,750 |
| 2017 | $1,724 | $23,760 | $6,010 | $17,750 |
| 2016 | $1,913 | $24,920 | $6,010 | $18,910 |
| 2015 | $1,894 | $24,920 | $6,010 | $18,910 |
| 2014 | $1,894 | $24,920 | $6,010 | $18,910 |
| 2012 | -- | $27,470 | $6,010 | $21,460 |
Source: Public Records
Map
Nearby Homes
- 1770 Piper Ln Unit 208
- 1740 Piper Ln
- 5710 Coach Dr W Unit E
- 5695 Coach Dr E Unit E
- 2278 Millwood Rd
- 5685 Coach Dr E Unit D
- 5660 Coach Dr W Unit C
- 2225 Coach Dr Unit L
- 1457 Carriage Trace Blvd Unit 4
- 6063 Hackamore Trail Unit 18
- 6067 Hackamore Trail Unit 20
- 2132 Hewitt Ave Unit 12132
- 6102 Singletree Ln
- 2236 E Whipp Rd
- 6350 Gwinnett Ln Unit 1326
- 2549 Montbello Cir
- 1973 Home Path Ct
- 6610 Green Branch Dr
- 5310 Glenmina Dr
- 5335 Glendon Ln
- 1705 Piper Ln Unit 208
- 1705 Piper Ln Unit 1705205
- 1705 Piper Ln Unit 1705104
- 1705 Piper Ln Unit 1705103
- 1705 Piper Ln Unit 1705102
- 1705 Piper Ln Unit 1705101
- 1705 Piper Ln Unit 205
- 1705 Piper Ln Unit 102
- 1705 Piper Ln Unit 104
- 1705 Piper Ln Unit 101
- 1705 Piper Ln Unit 1705207
- 1705 Piper Ln Unit 1705208
- 1705 Piper Ln Unit 103
- 1705 Piper Ln
- 1705 Piper Ln Unit 206
- 1705 Piper Ln Unit 207
- 1715 Piper Ln Unit 207
- 1715 Piper Ln Unit 1715207
- 1715 Piper Ln Unit 1715206
- 1715 Piper Ln Unit 1715205