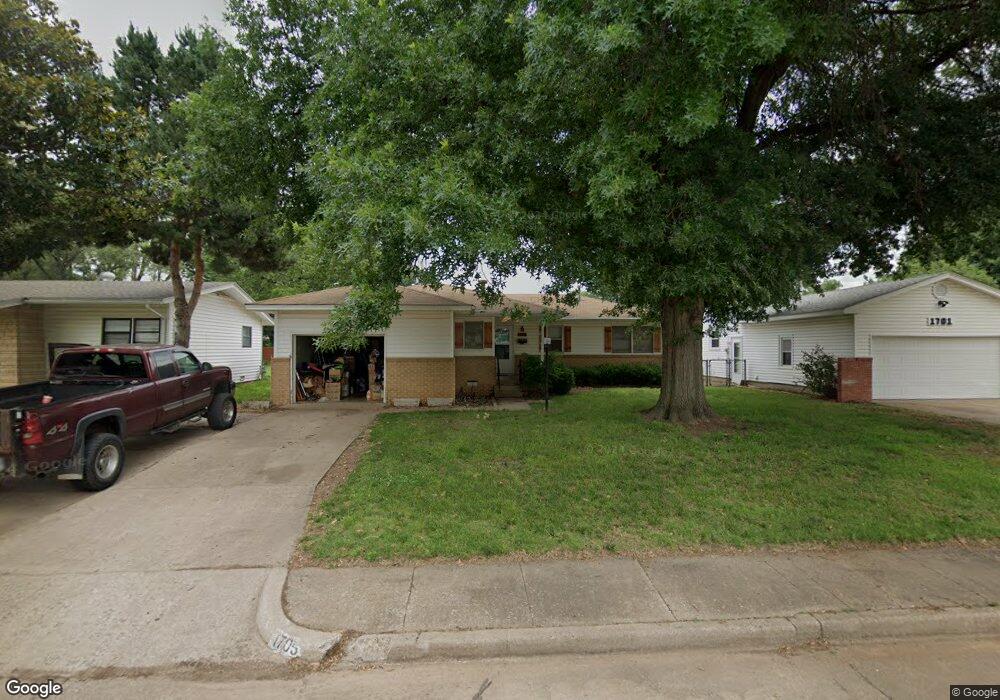
1705 Richway Dr Ponca City, OK 74601
Estimated Value: $89,000 - $96,000
2
Beds
1
Bath
979
Sq Ft
$95/Sq Ft
Est. Value
About This Home
This home is located at 1705 Richway Dr, Ponca City, OK 74601 and is currently estimated at $92,702, approximately $94 per square foot. 1705 Richway Dr is a home located in Kay County with nearby schools including Liberty Elementary School, Ponca City West Middle School, and Ponca City East Middle School.
Ownership History
Date
Name
Owned For
Owner Type
Purchase Details
Closed on
Sep 27, 2018
Sold by
Weers Robrt L and Weers Dixie
Bought by
Jennings Kristina M
Current Estimated Value
Home Financials for this Owner
Home Financials are based on the most recent Mortgage that was taken out on this home.
Original Mortgage
$46,353
Outstanding Balance
$40,423
Interest Rate
4.5%
Mortgage Type
Commercial
Estimated Equity
$52,279
Purchase Details
Closed on
May 16, 2007
Sold by
Haney Jo Ann and Haney Donald J
Bought by
Weers Robert L
Home Financials for this Owner
Home Financials are based on the most recent Mortgage that was taken out on this home.
Original Mortgage
$49,500
Interest Rate
6.17%
Mortgage Type
New Conventional
Purchase Details
Closed on
Dec 26, 2001
Sold by
Dan Bain Etal
Bought by
Dan Bain
Purchase Details
Closed on
Jul 26, 2001
Sold by
Alice Hood
Bought by
Dan Bain Etal and Dan 2
Purchase Details
Closed on
Jun 9, 1998
Sold by
Everett Stumbaugh Etal
Bought by
Everett Stumbaugh Etal
Create a Home Valuation Report for This Property
The Home Valuation Report is an in-depth analysis detailing your home's value as well as a comparison with similar homes in the area
Home Values in the Area
Average Home Value in this Area
Purchase History
| Date | Buyer | Sale Price | Title Company |
|---|---|---|---|
| Jennings Kristina M | $60,000 | Stewart Escrow & Title | |
| Weers Robert L | $55,000 | -- | |
| Dan Bain | -- | -- | |
| Dan Bain Etal | -- | -- | |
| Dan Bain Etal | $47,500 | -- | |
| Everett Stumbaugh Etal | -- | -- |
Source: Public Records
Mortgage History
| Date | Status | Borrower | Loan Amount |
|---|---|---|---|
| Open | Jennings Kristina M | $46,353 | |
| Previous Owner | Weers Robert L | $49,500 |
Source: Public Records
Tax History Compared to Growth
Tax History
| Year | Tax Paid | Tax Assessment Tax Assessment Total Assessment is a certain percentage of the fair market value that is determined by local assessors to be the total taxable value of land and additions on the property. | Land | Improvement |
|---|---|---|---|---|
| 2024 | $572 | $7,042 | $858 | $6,184 |
| 2023 | $572 | $6,837 | $858 | $5,979 |
| 2022 | $537 | $6,638 | $858 | $5,780 |
| 2021 | $539 | $6,638 | $858 | $5,780 |
| 2020 | $534 | $6,638 | $858 | $5,780 |
| 2019 | $535 | $6,600 | $858 | $5,742 |
| 2018 | $512 | $5,287 | $660 | $4,627 |
| 2017 | $518 | $5,287 | $660 | $4,627 |
| 2016 | $534 | $5,388 | $660 | $4,728 |
| 2015 | $511 | $5,141 | $660 | $4,481 |
| 2014 | $478 | $4,896 | $660 | $4,236 |
Source: Public Records
Map
Nearby Homes
- 1709 Richway Dr
- 1701 Richway Dr
- 1713 Richway Dr
- 1617 Richway Dr
- 1704 Potomac Dr
- 1700 Potomac Dr
- 1704 Richway Dr
- 1801 Richway Dr
- 1613 Richway Dr
- 1700 Richway Dr
- 1708 Richway Dr
- 1616 Potomac Dr
- 1712 Potomac Dr
- 1616 Richway Dr
- 1712 Richway Dr
- 1612 Potomac Dr
- 1805 Richway Dr
- 1609 Richway Dr
- 1612 Richway Dr
- 1800 Potomac Dr