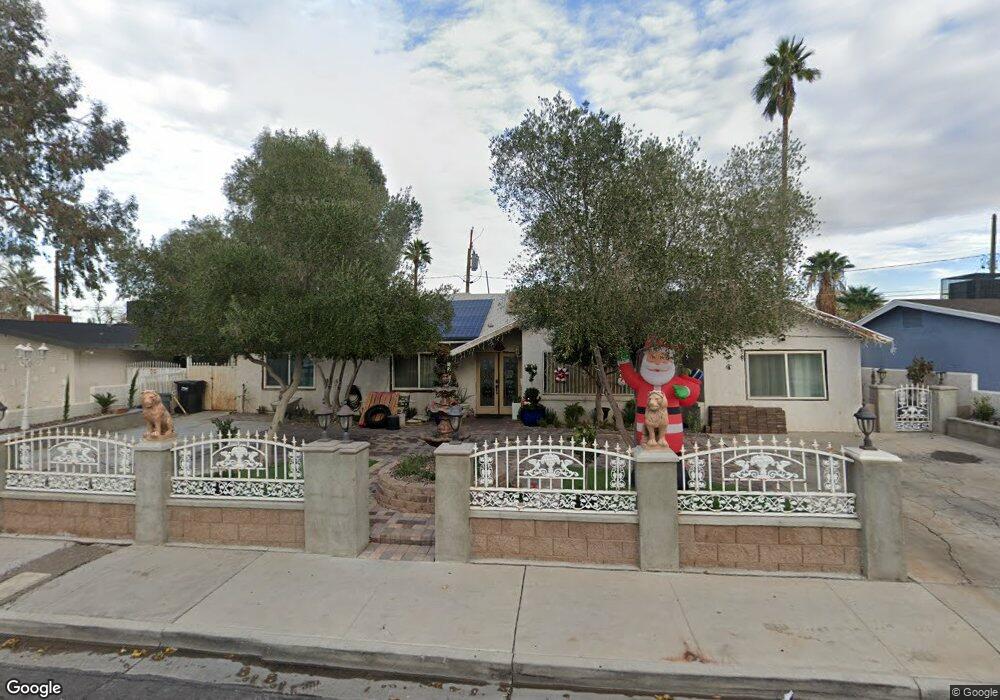
1705 S 8th St Las Vegas, NV 89104
Huntridge NeighborhoodEstimated Value: $403,935 - $494,000
4
Beds
2
Baths
1,884
Sq Ft
$237/Sq Ft
Est. Value
About This Home
This home is located at 1705 S 8th St, Las Vegas, NV 89104 and is currently estimated at $445,734, approximately $236 per square foot. 1705 S 8th St is a home located in Clark County with nearby schools including John S Park Elementary School, Roy West Martin Middle School, and Valley High School.
Ownership History
Date
Name
Owned For
Owner Type
Purchase Details
Closed on
Oct 28, 2020
Sold by
Tricon Sfr 2020 2 Equitty Owner Llc
Bought by
Tricon Sfr 2020 2 Borrower Llc
Current Estimated Value
Purchase Details
Closed on
Aug 31, 2001
Sold by
Arzola David and Arzola Manuela
Bought by
Barranco Jose
Home Financials for this Owner
Home Financials are based on the most recent Mortgage that was taken out on this home.
Original Mortgage
$136,060
Interest Rate
6.73%
Mortgage Type
FHA
Purchase Details
Closed on
Mar 22, 1995
Sold by
Lee Irvin A and Lee Donna M
Bought by
Arzola David and Arzola Manuela
Home Financials for this Owner
Home Financials are based on the most recent Mortgage that was taken out on this home.
Original Mortgage
$91,053
Interest Rate
8.86%
Mortgage Type
FHA
Create a Home Valuation Report for This Property
The Home Valuation Report is an in-depth analysis detailing your home's value as well as a comparison with similar homes in the area
Home Values in the Area
Average Home Value in this Area
Purchase History
| Date | Buyer | Sale Price | Title Company |
|---|---|---|---|
| Tricon Sfr 2020 2 Borrower Llc | -- | None Available | |
| Tricon Sfr 2020 2 Equity Owner Llc | -- | Os National Resware | |
| Tricon American Llc | -- | Os National Resware | |
| Tah Equity Lp | -- | Os National Resware | |
| Barranco Jose | $138,000 | Old Republic Title Company | |
| Arzola David | $92,000 | United Title |
Source: Public Records
Mortgage History
| Date | Status | Borrower | Loan Amount |
|---|---|---|---|
| Previous Owner | Barranco Jose | $136,060 | |
| Previous Owner | Arzola David | $91,053 |
Source: Public Records
Tax History Compared to Growth
Tax History
| Year | Tax Paid | Tax Assessment Tax Assessment Total Assessment is a certain percentage of the fair market value that is determined by local assessors to be the total taxable value of land and additions on the property. | Land | Improvement |
|---|---|---|---|---|
| 2025 | $2,851 | $61,973 | $36,400 | $25,573 |
| 2024 | $3,331 | $61,973 | $36,400 | $25,573 |
| 2023 | $3,331 | $65,455 | $42,350 | $23,105 |
| 2022 | $1,899 | $50,801 | $30,100 | $20,701 |
| 2021 | $2,796 | $48,993 | $29,750 | $19,243 |
| 2020 | $937 | $49,844 | $31,150 | $18,694 |
| 2019 | $878 | $43,587 | $25,550 | $18,037 |
| 2018 | $838 | $39,664 | $22,750 | $16,914 |
| 2017 | $1,128 | $34,397 | $17,623 | $16,774 |
| 2016 | $1,038 | $30,115 | $13,965 | $16,150 |
| 2015 | $1,279 | $27,299 | $11,638 | $15,661 |
| 2014 | $1,056 | $22,454 | $6,983 | $15,471 |
Source: Public Records
Map
Nearby Homes
- 1811 S 7th St
- 813 Bonita Ave
- 1420 S 8th St
- 913 Bonita Ave
- 556 E Oakey Blvd
- 908 Bonita Ave
- 1303 S 8th St
- 1041 E Saint Louis Ave
- 1707 Santa Paula Dr
- 1020 Wengert Ave
- 1502 Rexford Place
- 1506 Rexford Place
- 1405 S 11th St
- 1212 S 7th St
- 2111 S Maryland Pkwy
- 1808 Weldon Place
- 1601 S Maryland Pkwy
- 2200 Santa Ynez Dr
- 1905 Weldon Place
- 2312 S 6th St