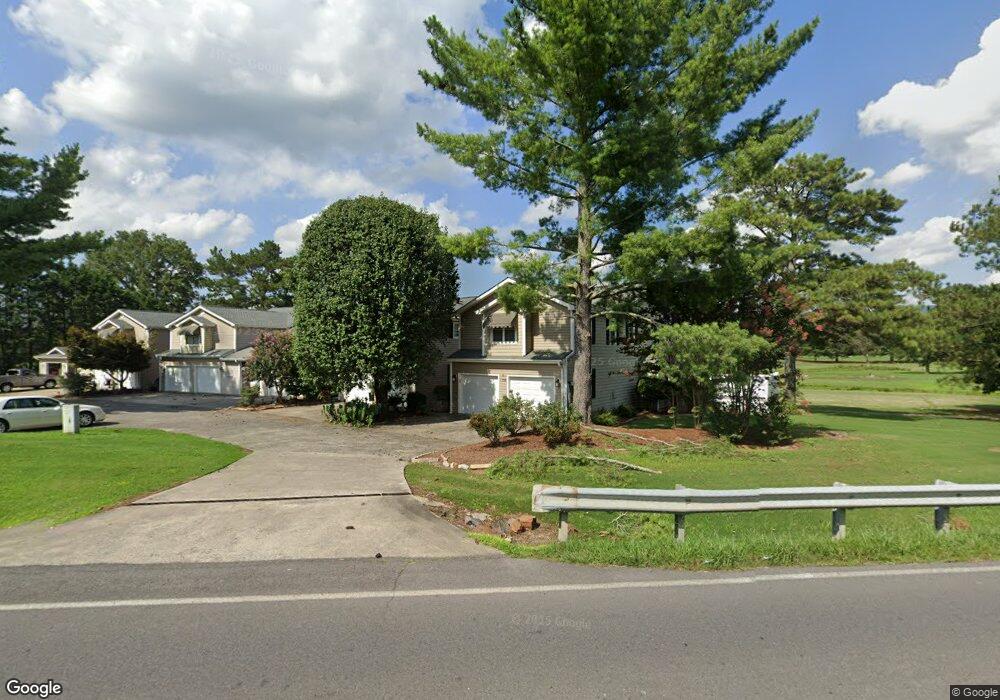
1705 Spring Place Smyrna Rd Unit F Chatsworth, GA 30705
Estimated Value: $191,234 - $274,000
--
Bed
2
Baths
1,165
Sq Ft
$212/Sq Ft
Est. Value
About This Home
This home is located at 1705 Spring Place Smyrna Rd Unit F, Chatsworth, GA 30705 and is currently estimated at $247,559, approximately $212 per square foot. 1705 Spring Place Smyrna Rd Unit F is a home located in Murray County with nearby schools including Spring Place Elementary School, Gladden Middle School, and Murray County High School.
Ownership History
Date
Name
Owned For
Owner Type
Purchase Details
Closed on
Apr 30, 2020
Sold by
Sinclair Pamela Elizabeth
Bought by
Powers Edward M and Powers Marilyn D
Current Estimated Value
Purchase Details
Closed on
Jan 12, 2017
Sold by
Sharon D
Bought by
Sinclair Pamela Elizabeth
Home Financials for this Owner
Home Financials are based on the most recent Mortgage that was taken out on this home.
Original Mortgage
$82,500
Interest Rate
4.16%
Mortgage Type
New Conventional
Purchase Details
Closed on
May 28, 2004
Sold by
Smith Alton M and Smith Betty S
Bought by
Norris Sharon D and Norris Wes J
Purchase Details
Closed on
Jan 8, 1998
Sold by
Strahley David
Bought by
Smith Alton M and Smith Bett
Purchase Details
Closed on
Mar 5, 1993
Bought by
Strahley David
Create a Home Valuation Report for This Property
The Home Valuation Report is an in-depth analysis detailing your home's value as well as a comparison with similar homes in the area
Home Values in the Area
Average Home Value in this Area
Purchase History
| Date | Buyer | Sale Price | Title Company |
|---|---|---|---|
| Powers Edward M | $140,000 | -- | |
| Sinclair Pamela Elizabeth | $110,000 | -- | |
| Norris Sharon D | $115,000 | -- | |
| Smith Alton M | $67,500 | -- | |
| Strahley David | $59,000 | -- |
Source: Public Records
Mortgage History
| Date | Status | Borrower | Loan Amount |
|---|---|---|---|
| Previous Owner | Sinclair Pamela Elizabeth | $82,500 |
Source: Public Records
Tax History Compared to Growth
Tax History
| Year | Tax Paid | Tax Assessment Tax Assessment Total Assessment is a certain percentage of the fair market value that is determined by local assessors to be the total taxable value of land and additions on the property. | Land | Improvement |
|---|---|---|---|---|
| 2024 | $965 | $71,480 | $1,200 | $70,280 |
| 2023 | $935 | $69,080 | $1,200 | $67,880 |
| 2022 | $717 | $59,960 | $1,200 | $58,760 |
| 2021 | $464 | $48,480 | $1,200 | $47,280 |
| 2020 | $877 | $37,640 | $1,200 | $36,440 |
| 2019 | $880 | $37,640 | $1,200 | $36,440 |
| 2018 | $880 | $37,640 | $1,200 | $36,440 |
| 2017 | $0 | $30,000 | $1,200 | $28,800 |
| 2016 | $101 | $26,040 | $1,200 | $24,840 |
| 2015 | -- | $26,040 | $1,200 | $24,840 |
| 2014 | -- | $26,040 | $1,200 | $24,840 |
| 2013 | -- | $26,040 | $1,200 | $24,840 |
Source: Public Records
Map
Nearby Homes
- 23 Brandon Ln
- 53 South Way
- 1379 Highway 225 S
- 0 Torino Dr Unit 131322
- 628 Torino Dr
- 132 Katie Ln
- 357 Katie Ln
- 51 Corvette Dr
- 168 Charger Dr
- 0 Chevelle Dr Unit 131116
- 2010 Old Dalton Ellijay Rd
- 110 Sitton Rd S
- 0 Highway 225 S Unit 7662590
- 0 Highway 225 S Unit 9659
- 0 Highway 52 Unit 417342
- 0 Highway 52 Unit 1516971
- 0 Highway 52 Unit 10573726
- 0 Highway 52 Unit 415667
- 1032 Corvette Dr
- 399 Bell Loop
- 1705 Spring Place Smyrna Rd Unit B
- 1705 Spring Place Smyrna Rd Unit B
- 1705 Spring Place Smyrna Rd Unit C
- 1705 Spring Place Smyrna Rd Unit D
- 1705 Spring Place Smyrna Rd
- 1705 Spring Place Smyrna Rd Unit A
- 1705 Spring Place Smyrna Rd Unit A
- 1705 Spring Place Smyrna Rd Unit A
- 1705 Spring
- 1728 Spring Place Smyrna Rd
- 19 Bishop Pond Rd
- 59 Bishop Pond Rd
- 1591 Spring Place Smyrna Rd
- 593 Parson Rd
- 593 Parson Rd
- 105 Bishop Pond Rd
- 143 Bishop Pond Rd
- 262 Timberbrook Dr
- 165 S Springs Rd
- 171 S Springs Rd