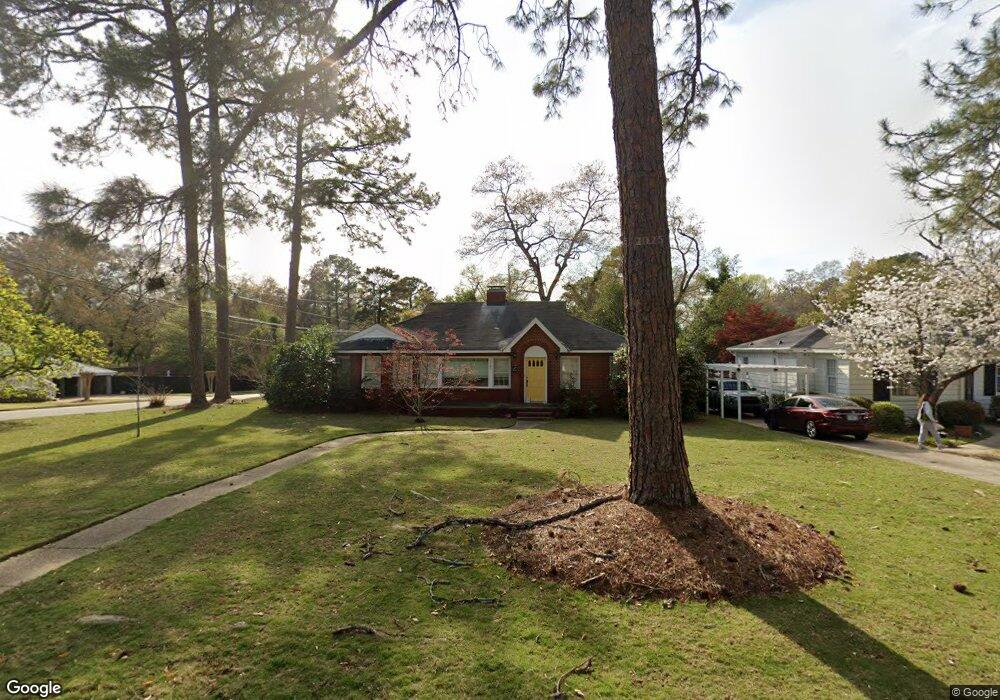
1705 Wells Dr Columbus, GA 31906
Wyntonn Grove NeighborhoodEstimated Value: $263,884 - $326,000
3
Beds
3
Baths
2,083
Sq Ft
$140/Sq Ft
Est. Value
About This Home
This home is located at 1705 Wells Dr, Columbus, GA 31906 and is currently estimated at $290,971, approximately $139 per square foot. 1705 Wells Dr is a home located in Muscogee County with nearby schools including Clubview Elementary School, Richards Middle School, and Hardaway High School.
Ownership History
Date
Name
Owned For
Owner Type
Purchase Details
Closed on
Sep 15, 2023
Sold by
Smith Randall
Bought by
1705 Wells Drive Llc
Current Estimated Value
Purchase Details
Closed on
Mar 9, 2018
Sold by
Bush James
Bought by
Smith Randall
Home Financials for this Owner
Home Financials are based on the most recent Mortgage that was taken out on this home.
Original Mortgage
$50,000
Interest Rate
4.32%
Mortgage Type
New Conventional
Purchase Details
Closed on
Mar 2, 2011
Sold by
Davis Alan G and Davis Cecelia H
Bought by
Bush James A
Home Financials for this Owner
Home Financials are based on the most recent Mortgage that was taken out on this home.
Original Mortgage
$150,000
Interest Rate
4.71%
Mortgage Type
VA
Create a Home Valuation Report for This Property
The Home Valuation Report is an in-depth analysis detailing your home's value as well as a comparison with similar homes in the area
Home Values in the Area
Average Home Value in this Area
Purchase History
| Date | Buyer | Sale Price | Title Company |
|---|---|---|---|
| 1705 Wells Drive Llc | -- | None Listed On Document | |
| Smith Randall | $149,750 | -- | |
| Bush James A | $150,000 | None Available |
Source: Public Records
Mortgage History
| Date | Status | Borrower | Loan Amount |
|---|---|---|---|
| Previous Owner | Smith Randall | $50,000 | |
| Previous Owner | Bush James A | $150,000 |
Source: Public Records
Tax History Compared to Growth
Tax History
| Year | Tax Paid | Tax Assessment Tax Assessment Total Assessment is a certain percentage of the fair market value that is determined by local assessors to be the total taxable value of land and additions on the property. | Land | Improvement |
|---|---|---|---|---|
| 2025 | $3,629 | $92,712 | $17,768 | $74,944 |
| 2024 | $3,629 | $92,712 | $17,768 | $74,944 |
| 2023 | $3,652 | $92,712 | $17,768 | $74,944 |
| 2022 | $3,071 | $75,204 | $17,768 | $57,436 |
| 2021 | $2,864 | $70,148 | $17,768 | $52,380 |
| 2020 | $2,865 | $70,148 | $17,768 | $52,380 |
| 2019 | $2,453 | $59,880 | $14,800 | $45,080 |
| 2018 | $2,943 | $71,832 | $17,768 | $54,064 |
| 2017 | $2,952 | $71,832 | $17,768 | $54,064 |
| 2016 | $2,859 | $69,320 | $9,081 | $60,239 |
| 2015 | $2,863 | $69,320 | $9,081 | $60,239 |
| 2014 | $2,866 | $69,320 | $9,081 | $60,239 |
| 2013 | -- | $69,320 | $9,081 | $60,239 |
Source: Public Records
Map
Nearby Homes