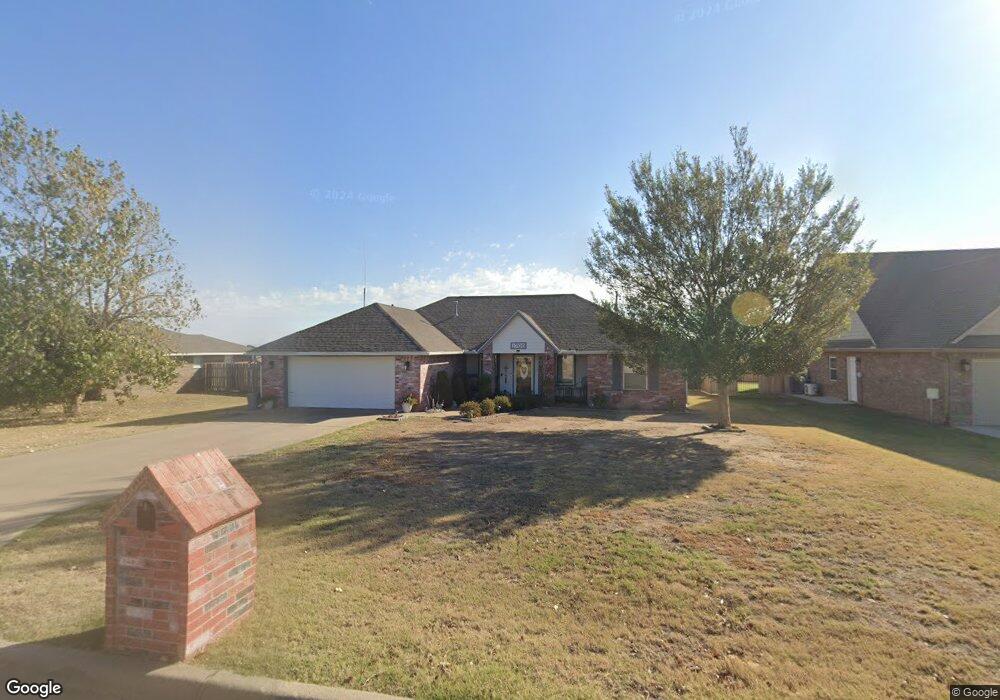
1705 Windmill Rd Blackwell, OK 74631
Estimated Value: $185,000 - $260,000
3
Beds
2
Baths
2,219
Sq Ft
$103/Sq Ft
Est. Value
About This Home
This home is located at 1705 Windmill Rd, Blackwell, OK 74631 and is currently estimated at $227,779, approximately $102 per square foot. 1705 Windmill Rd is a home located in Kay County with nearby schools including Blackwell Elementary School, Blackwell Middle School, and Blackwell High School.
Ownership History
Date
Name
Owned For
Owner Type
Purchase Details
Closed on
Mar 17, 2021
Sold by
Arnold Tammy Renee and Cordell Vicki Dawn
Bought by
Gregory Derrell Galen and Gregory Vernia
Current Estimated Value
Home Financials for this Owner
Home Financials are based on the most recent Mortgage that was taken out on this home.
Original Mortgage
$142,500
Outstanding Balance
$127,159
Interest Rate
2.7%
Mortgage Type
New Conventional
Estimated Equity
$100,620
Purchase Details
Closed on
Jan 24, 2008
Sold by
Roach James A
Bought by
Roach James A and Cordell Vicki Dawn
Purchase Details
Closed on
May 17, 2007
Sold by
Olsen B Joan
Bought by
Roach James A
Purchase Details
Closed on
Aug 1, 2005
Sold by
Palmer Kelly J and Palmer Duanea L
Bought by
Roach James A
Purchase Details
Closed on
Mar 9, 2004
Sold by
Letha R Reese Estate
Bought by
Joan Olsen B and Ames Roach
Purchase Details
Closed on
Oct 19, 1998
Sold by
Glenda Edwin and Glenda Urban
Bought by
Rae Reese L
Create a Home Valuation Report for This Property
The Home Valuation Report is an in-depth analysis detailing your home's value as well as a comparison with similar homes in the area
Home Values in the Area
Average Home Value in this Area
Purchase History
| Date | Buyer | Sale Price | Title Company |
|---|---|---|---|
| Gregory Derrell Galen | $150,000 | Security Title Service | |
| Roach James A | -- | -- | |
| Roach James A | $70,000 | -- | |
| Roach James A | $5,000 | -- | |
| Joan Olsen B | $140,000 | -- | |
| -- | -- | -- | |
| Rae Reese L | $10,200 | -- |
Source: Public Records
Mortgage History
| Date | Status | Borrower | Loan Amount |
|---|---|---|---|
| Open | Gregory Derrell Galen | $142,500 |
Source: Public Records
Tax History
| Year | Tax Paid | Tax Assessment Tax Assessment Total Assessment is a certain percentage of the fair market value that is determined by local assessors to be the total taxable value of land and additions on the property. | Land | Improvement |
|---|---|---|---|---|
| 2025 | $1,981 | $19,654 | $1,733 | $17,921 |
| 2024 | $1,915 | $19,082 | $1,733 | $17,349 |
| 2023 | $1,915 | $18,526 | $1,733 | $16,793 |
| 2022 | $1,624 | $17,644 | $1,733 | $15,911 |
| 2021 | $1,216 | $13,979 | $1,733 | $12,246 |
| 2020 | $1,199 | $13,814 | $1,733 | $12,081 |
| 2019 | $1,174 | $13,412 | $1,733 | $11,679 |
| 2018 | $1,168 | $13,712 | $1,733 | $11,979 |
| 2017 | $1,221 | $13,836 | $1,733 | $12,103 |
| 2016 | $1,187 | $13,985 | $1,733 | $12,252 |
| 2015 | $1,201 | $14,166 | $1,733 | $12,433 |
| 2014 | $1,228 | $14,192 | $1,733 | $12,459 |
Source: Public Records
Map
Nearby Homes
- 1602 S 13th St
- 922 Robin Rd
- 1330 S 9th St
- 1312 S 8th St
- 277 Enlow Ave
- 307 Fairview Ave
- 1004 S 11th St
- 1002 S 9th St
- 903 S 13th St
- 119 Enlow Ave
- 112 Enlow Ave
- 1314 S 2nd St
- 117 Urbana Dr
- 1913 Ridgeway Rd
- 18693-18999 W Ferguson Ave
- 1510 S D St
- 520 E Coolidge Ave
- 2014 Willow Place
- 501 S 21st St
- 1300 S E St
- 1703 Windmill Rd
- 1709 Windmill Rd
- 1701 Windmill Rd
- 1707 Windmill Rd
- 1220 Surrey Ln
- 1702 Windmill Rd
- 1125 Surrey Ln
- 1604 Windmill Rd
- 1226 Surrey Ln
- 1805 Whiffletree Rd
- 1605 Country Rd
- 1609 Country Rd
- 1611 Country Rd
- 1230 W Chrysler Ave
- 1602 Country Rd
- 1635 Country Rd
- 1328 W Chrysler Ave
- 1305 Fringe Rd
- 1608 Country Rd
- 1633 Country Rd
Your Personal Tour Guide
Ask me questions while you tour the home.