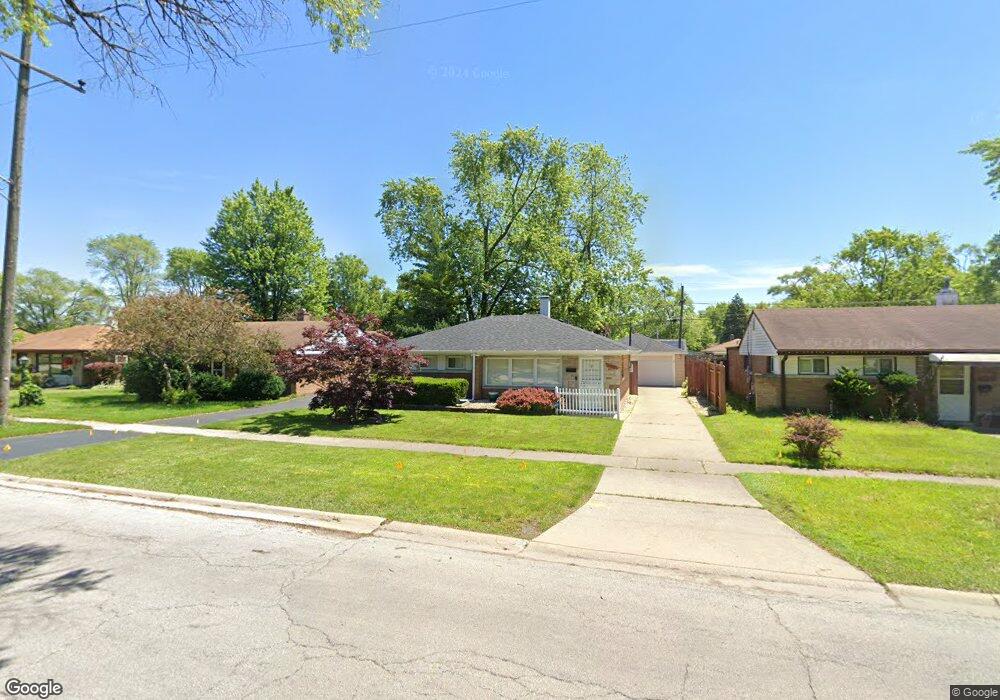
17051 Chicago Ave Lansing, IL 60438
Estimated Value: $128,686 - $167,000
2
Beds
1
Bath
931
Sq Ft
$155/Sq Ft
Est. Value
About This Home
This home is located at 17051 Chicago Ave, Lansing, IL 60438 and is currently estimated at $144,672, approximately $155 per square foot. 17051 Chicago Ave is a home located in Cook County with nearby schools including Reavis Elementary School, Memorial Jr High School, and Thornton Fractnl So High School.
Ownership History
Date
Name
Owned For
Owner Type
Purchase Details
Closed on
Jan 28, 2012
Sold by
Wolfe Veronica
Bought by
Wolfe Veronica and Wolfe Tanika
Current Estimated Value
Purchase Details
Closed on
Oct 30, 2002
Sold by
Puszakowski Roman and Puszakowski Annette
Bought by
Wolfe Veronica
Home Financials for this Owner
Home Financials are based on the most recent Mortgage that was taken out on this home.
Original Mortgage
$81,000
Outstanding Balance
$32,848
Interest Rate
6.1%
Estimated Equity
$111,824
Purchase Details
Closed on
Apr 30, 1999
Sold by
Luckey William P
Bought by
Puszakowski Roman and Puszakowski Annette
Home Financials for this Owner
Home Financials are based on the most recent Mortgage that was taken out on this home.
Original Mortgage
$77,658
Interest Rate
7.04%
Mortgage Type
FHA
Create a Home Valuation Report for This Property
The Home Valuation Report is an in-depth analysis detailing your home's value as well as a comparison with similar homes in the area
Home Values in the Area
Average Home Value in this Area
Purchase History
| Date | Buyer | Sale Price | Title Company |
|---|---|---|---|
| Wolfe Veronica | -- | None Available | |
| Wolfe Veronica | $81,000 | -- | |
| Puszakowski Roman | $78,000 | -- |
Source: Public Records
Mortgage History
| Date | Status | Borrower | Loan Amount |
|---|---|---|---|
| Open | Wolfe Veronica | $81,000 | |
| Previous Owner | Puszakowski Roman | $77,658 |
Source: Public Records
Tax History
| Year | Tax Paid | Tax Assessment Tax Assessment Total Assessment is a certain percentage of the fair market value that is determined by local assessors to be the total taxable value of land and additions on the property. | Land | Improvement |
|---|---|---|---|---|
| 2025 | $2,992 | $9,500 | $2,650 | $6,850 |
| 2024 | $2,992 | $9,500 | $2,650 | $6,850 |
| 2023 | $2,486 | $9,500 | $2,650 | $6,850 |
| 2022 | $2,486 | $7,247 | $2,319 | $4,928 |
| 2021 | $2,475 | $7,245 | $2,318 | $4,927 |
| 2020 | $2,431 | $7,245 | $2,318 | $4,927 |
| 2019 | $2,791 | $8,332 | $2,153 | $6,179 |
| 2018 | $2,736 | $8,332 | $2,153 | $6,179 |
| 2017 | $2,797 | $8,332 | $2,153 | $6,179 |
| 2016 | $2,615 | $7,280 | $1,987 | $5,293 |
| 2015 | $2,366 | $7,280 | $1,987 | $5,293 |
| 2014 | $2,361 | $7,280 | $1,987 | $5,293 |
| 2013 | $2,575 | $8,349 | $1,987 | $6,362 |
Source: Public Records
Map
Nearby Homes
- 17057 Park Ave
- 17115 Park Ave
- 17002 Lorenz Ave
- 2937 172nd St
- 17056 Burnham Ave
- 17303 Chicago Ave
- 17132 Walter St
- 1554 Burnham Ave
- 17246 Burnham Ave
- 2938 173rd Place
- 17153 Walter St
- 17303 Greenbay Ave
- 3018 Bernice Rd Unit 205
- 3312 E 170th St
- 17318 Walter St
- 3045 Bernice Rd
- 3061 Bernice Rd
- 3069 Bernice Rd
- 3127 Bernice Rd Unit 5
- 17226 Community St
- 17047 Chicago Ave
- 17057 Chicago Ave
- 17041 Chicago Ave
- 17052 Park Ave
- 17046 Park Ave
- 17056 Park Ave
- 17035 Chicago Ave
- 17042 Park Ave
- 17103 Chicago Ave
- 17050 Chicago Ave
- 17036 Park Ave
- 17056 Chicago Ave
- 17046 Chicago Ave
- 17031 Chicago Ave
- 17102 Park Ave
- 17107 Chicago Ave
- 17040 Chicago Ave
- 17032 Park Ave
- 17106 Park Ave
- 17034 Chicago Ave
Your Personal Tour Guide
Ask me questions while you tour the home.