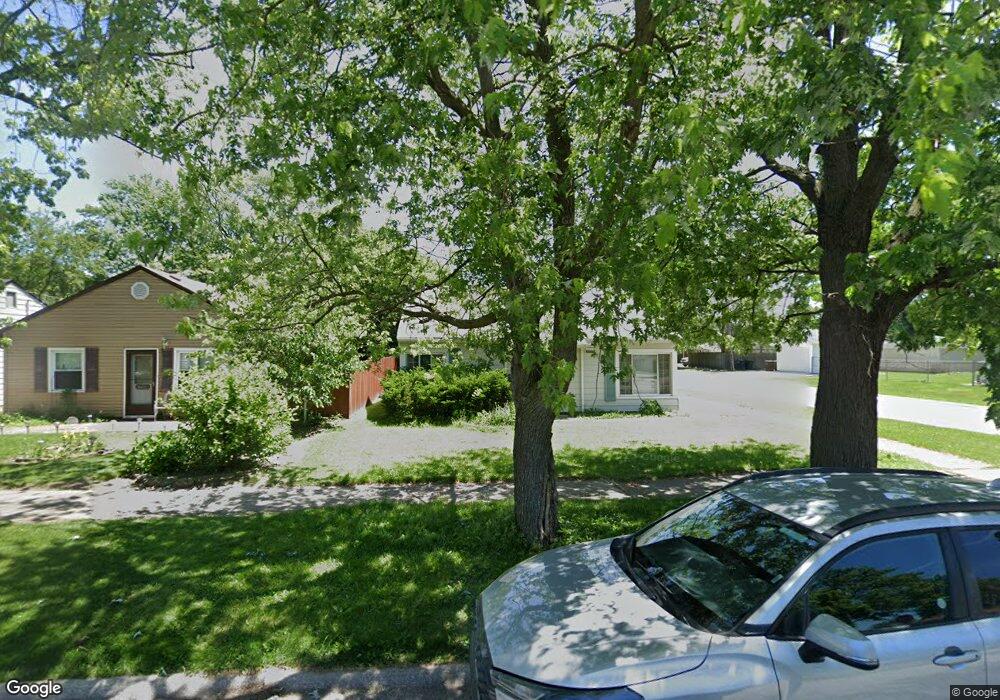
17057 Lorenz Ave Lansing, IL 60438
Estimated Value: $170,000 - $187,000
3
Beds
2
Baths
1,262
Sq Ft
$139/Sq Ft
Est. Value
About This Home
This home is located at 17057 Lorenz Ave, Lansing, IL 60438 and is currently estimated at $175,718, approximately $139 per square foot. 17057 Lorenz Ave is a home located in Cook County with nearby schools including Reavis Elementary School, Memorial Jr High School, and Thornton Fractnl So High School.
Ownership History
Date
Name
Owned For
Owner Type
Purchase Details
Closed on
Aug 29, 2025
Sold by
Ja Sfr 2 Llc
Bought by
Ja Sfr3 Llc
Current Estimated Value
Purchase Details
Closed on
Aug 7, 2020
Sold by
Ja Sfr Llc
Bought by
Ja Sfr 2 Llc
Purchase Details
Closed on
Nov 28, 2014
Sold by
Ja Capital Management Llc Series 17057
Bought by
Ja Sfr Llc
Purchase Details
Closed on
Jan 6, 2014
Sold by
Rodenberg Elizabeth
Bought by
Ja Capital Management Llc Series 17057
Purchase Details
Closed on
Dec 9, 2003
Sold by
Luce Judy
Bought by
Rodenberg Elizabeth
Home Financials for this Owner
Home Financials are based on the most recent Mortgage that was taken out on this home.
Original Mortgage
$114,207
Interest Rate
6.08%
Mortgage Type
FHA
Create a Home Valuation Report for This Property
The Home Valuation Report is an in-depth analysis detailing your home's value as well as a comparison with similar homes in the area
Home Values in the Area
Average Home Value in this Area
Purchase History
| Date | Buyer | Sale Price | Title Company |
|---|---|---|---|
| Ja Sfr3 Llc | -- | None Listed On Document | |
| Ja Sfr 2 Llc | -- | Attorney | |
| Ja Sfr Llc | -- | None Available | |
| Ja Capital Management Llc Series 17057 | $22,000 | None Available | |
| Rodenberg Elizabeth | $116,000 | Stewart Title Of Illinois |
Source: Public Records
Mortgage History
| Date | Status | Borrower | Loan Amount |
|---|---|---|---|
| Previous Owner | Rodenberg Elizabeth | $114,207 |
Source: Public Records
Tax History Compared to Growth
Tax History
| Year | Tax Paid | Tax Assessment Tax Assessment Total Assessment is a certain percentage of the fair market value that is determined by local assessors to be the total taxable value of land and additions on the property. | Land | Improvement |
|---|---|---|---|---|
| 2024 | $4,838 | $10,000 | $2,099 | $7,901 |
| 2023 | $4,919 | $10,000 | $2,099 | $7,901 |
| 2022 | $4,919 | $7,570 | $1,837 | $5,733 |
| 2021 | $4,785 | $7,569 | $1,836 | $5,733 |
| 2020 | $4,441 | $7,569 | $1,836 | $5,733 |
| 2019 | $4,089 | $7,182 | $1,705 | $5,477 |
| 2018 | $4,013 | $7,182 | $1,705 | $5,477 |
| 2017 | $4,765 | $8,446 | $1,705 | $6,741 |
| 2016 | $3,911 | $7,152 | $1,574 | $5,578 |
| 2015 | $3,634 | $7,152 | $1,574 | $5,578 |
| 2014 | $2,296 | $7,152 | $1,574 | $5,578 |
| 2013 | $2,269 | $7,669 | $1,574 | $6,095 |
Source: Public Records
Map
Nearby Homes
- 17048 Lorenz Ave
- 17137 Greenbay Ave
- 17130 Park Ave
- 17138 Burnham Ave
- 17132 Walter St
- 17153 Burnham Ave
- 17157 Chicago Ave
- 17002 Chicago Ave
- 17153 Walter St
- 17157 Walter St
- 3312 E 170th St
- 17303 Chicago Ave
- 17303 Roy St
- 17128 Grant St
- 3026 Bernice Rd Unit 308
- 17317 Roy St
- 3010 Bernice Rd Unit 303
- 395 166th St
- 2950 Bernice Rd
- 3127 Bernice Rd Unit 2
- 17053 Lorenz Ave
- 17049 Lorenz Ave
- 17103 Lorenz Ave
- 17045 Lorenz Ave
- 17056 Greenbay Ave
- 17107 Lorenz Ave
- 17052 Greenbay Ave
- 17041 Lorenz Ave
- 17048 Greenbay Ave
- 17104 Greenbay Ave
- 17111 Lorenz Ave
- 17056 Lorenz Ave
- 17052 Lorenz Ave
- 17037 Lorenz Ave
- 17108 Greenbay Ave
- 17102 Lorenz Ave
- 17044 Lorenz Ave
- 17038 Greenbay Ave
- 17106 Lorenz Ave